Bitcoin Tests 72K Resistance as DXY Rebound Meets On-Chain Support
BTC pushed into the 72K ceiling while the dollar flashed a rebound signal. On April 10, regulatory news, exchange outflows, and ETF inflows supported price, but macro pressure kept the setup unresolved.
Why this matters today
Whether BTC breaks above 72,000 is a key determinant for short-term trend direction.
DXY’s bullish reversal pattern could lead to dollar strength, applying downward pressure on risk assets like BTC.
The interplay between positive regulatory news/on-chain signals and DXY strength risks is a critical watchpoint.
Bitcoin: reading the main chart
BTC’s 72K Resistance Test and Shark Pattern’s Bullish Signal
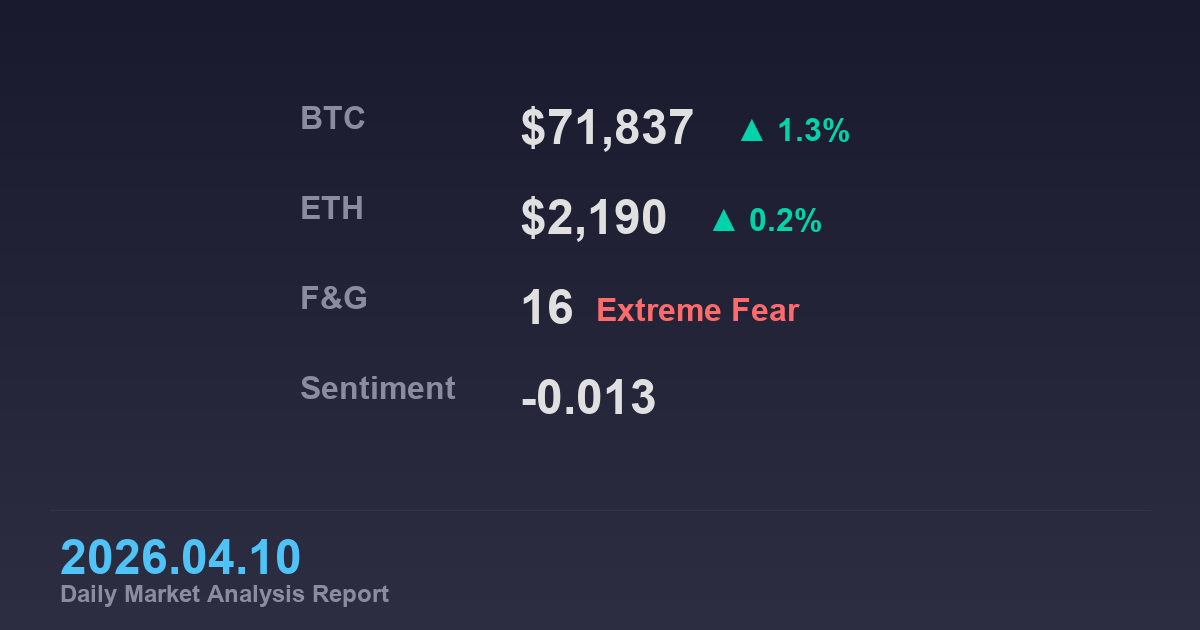
Bitcoin (BTC) is trading at $71,837, consolidating sideways in the 68,000-72,000 range on the 4-hour chart. Technical analysis reveals a Shark harmonic pattern (a method predicting price reversal points based on specific Fibonacci ratios) formed along X, A, B, C points, indicating a strong bullish reversal signal.
Key support levels are $68,000, $66,500, and $64,000, with resistance at $72,000 and $74,000. The current price near $72,000 resistance suggests a breakout could lead to a test up to $74,000. Conversely, a drop below the $68,000 support may accelerate downward pressure.
Price action is confined within the 7-day range ($66,877 – $72,111), with momentum indicators (+0.0066) showing mild upward pressure, indicating the market is approaching an inflection point.
BTC is testing 72,000 resistance, with the Shark pattern indicating a bullish reversal signal. Support at 68,000 and resistance at 72,000 are key levels.
Cross-asset confirmation
DXY Bullish Reversal Pattern as a Headwind for BTC
The DXY (Dollar Index) daily chart shows a downtrend, but a Crab pattern (a harmonic pattern forming at 0.618 Fibonacci level) and Alphawave present a strong bullish reversal signal, suggesting potential dollar strength.
Key support levels are at 0.618, 1.618, and 2.618 Fibonacci levels, with resistance at 100.643. If DXY reverses upward, it could act as downward pressure on Bitcoin, limiting its upward momentum.
DXY shows strong bullish reversal signals with Crab pattern and Alphawave, potentially acting as a headwind for BTC. Resistance at 100.643 and Fibonacci support levels are observed.
Macro and major headlines
Mixed Macro Environment with Regulatory Tailwinds and Fear Sentiment
A high-impact event (magnitude 8) reported regulatory tailwinds for the ‘CLARITY Act,’ which could have long-term positive effects on crypto markets. Additionally, Coinbase CEO’s related statement (source: Watcher Guru) boosts expectations for regulatory progress.
However, the Fear & Greed Index at 16 (Extreme Fear) indicates subdued market sentiment. Macro data like China’s CPI inflation easing (source: FXStreet Forex News) contributes to the overall negative sentiment (-0.013).
Ethereum (ETH) is up slightly at $2,190 (+0.2%), and S&P 500 (SPX) shows bullish (BUY) signals, suggesting sustained demand for some risk assets.
| Indicator | Current read | Market implication |
|---|---|---|
| BTC Price | $71,837 (+1.3%), 7-day range $66,877~$72,111 | Testing 72K resistance, sideways phase |
| Fear & Greed Index | 16 (Extreme Fear) | Extreme fear limits upward momentum |
| Exchange Net Outflow | -18,057 BTC (7-day) | Reduced selling pressure, supportive signal |
Table data reflects real-time or 7-day average values as of April 10, 2026.
On-chain and derivatives
On-Chain Outflows and Neutral Derivatives Support the Market
Exchange BTC net outflows (-18,057 BTC, 7-day) persist, suggesting reduced spot selling pressure and strong long-term holding sentiment, which can act as a positive support during price declines.
Funding rates (BTC 0.0004%, ETH 0.0000%) are at neutral levels, indicating no strong buying or selling pressure in derivatives markets. The USDTD 4h USDCD chart (related to stablecoins) serves as auxiliary data, showing typical liquidity patterns.
ETF net inflows ($166, 7-day), though small, signal continued fund inflows, reflecting maintained institutional interest.
The USDTD chart displays typical liquidity patterns, with on-chain net outflows and neutral funding rates indicating market support.
Near-term scenarios
Base case
If Bitcoin breaks above the 72,000 resistance, supported by the Shark pattern’s bullish signal and regulatory tailwinds, with exchange net outflows providing a cushion, it could extend its upward test toward 74,000 in the short term. The key is for DXY’s bullish reversal pattern to have limited impact, offsetting downward pressure.
Alternative case
If DXY strongly reverses upward, leading to pronounced dollar strength, and BTC fails to break 72,000 resistance, a retest of the 68,000 support level is possible, prolonging the sideways consolidation phase.
Checklist
- Monitor BTC’s breakout above 72,000 resistance.
- Watch for DXY’s breakout above 100.643 resistance and trend reversal.
- Check the persistence of exchange net outflows and ETF inflow indicators.
- Stay updated on regulatory news (e.g., CLARITY Act progress).
Related reads
2026년 04월 08일 암호화폐 시장 분석 2026년 04월 07일 암호화폐 시장 분석 2026년 04월 06일 암호화폐 시장 분석
FAQ
What is the Shark harmonic pattern?
The Shark pattern is a type of harmonic pattern (a method predicting price reversal points based on specific Fibonacci ratios) where X, A, B, C points form at specific ratios (e.g., 0.886, 1.13), indicating a strong bullish reversal signal. Its presence in the current BTC chart suggests short-term upside potential.
Why is DXY strength negative for Bitcoin?
When DXY (Dollar Index) rises, the dollar strengthens, potentially reducing the appeal of dollar-denominated assets like Bitcoin. This can lower demand for risk assets, acting as downward pressure on BTC prices.
What does a Fear & Greed Index of 16 (Extreme Fear) mean?
The Fear & Greed Index quantifies market sentiment from 0 (Extreme Fear) to 100 (Extreme Greed). A reading of 16 indicates extreme fear, meaning investors are cautious. Historically, this level can signal rebound potential but may accompany short-term volatility.
Related Posts

Newsletter
Weekly Quant & Market Insights
Get market analysis, quant strategy ideas, and AI & data tool insights delivered to your inbox.
Subscribe →