Bollinger Bands Usage: Volatility Analysis and Trading Timing
An overview of Bollinger Bands principles and practical application techniques. Covers band contraction and expansion, overbought/oversold signals, and combining with other indicators.

What Are Bollinger Bands?
Bollinger Bands are an indicator that shows how much the price moves within a certain range around a moving average. Developed by John Bollinger in the 1980s, they excel at visually representing volatility.
The core concept relates to statistical normal ranges. It’s normal for prices to stay within the bands; when they break out, it indicates abnormally high or low movement.
The Meaning of the Three Lines
Bollinger Bands consist of three lines:
| Line | Calculation | Meaning |
|---|---|---|
| Upper Band | Middle Line + Standard Deviation × 2 | Overbought / Heat zone |
| Middle Line | 20-day Simple Moving Average (SMA) | Short-term trend basis |
| Lower Band | Middle Line - Standard Deviation × 2 | Oversold / Calm zone |
Default parameters are 20 periods and 2 standard deviations. With this setup, about 95% of price data statistically falls within the bands. Moving outside indicates an abnormal movement.
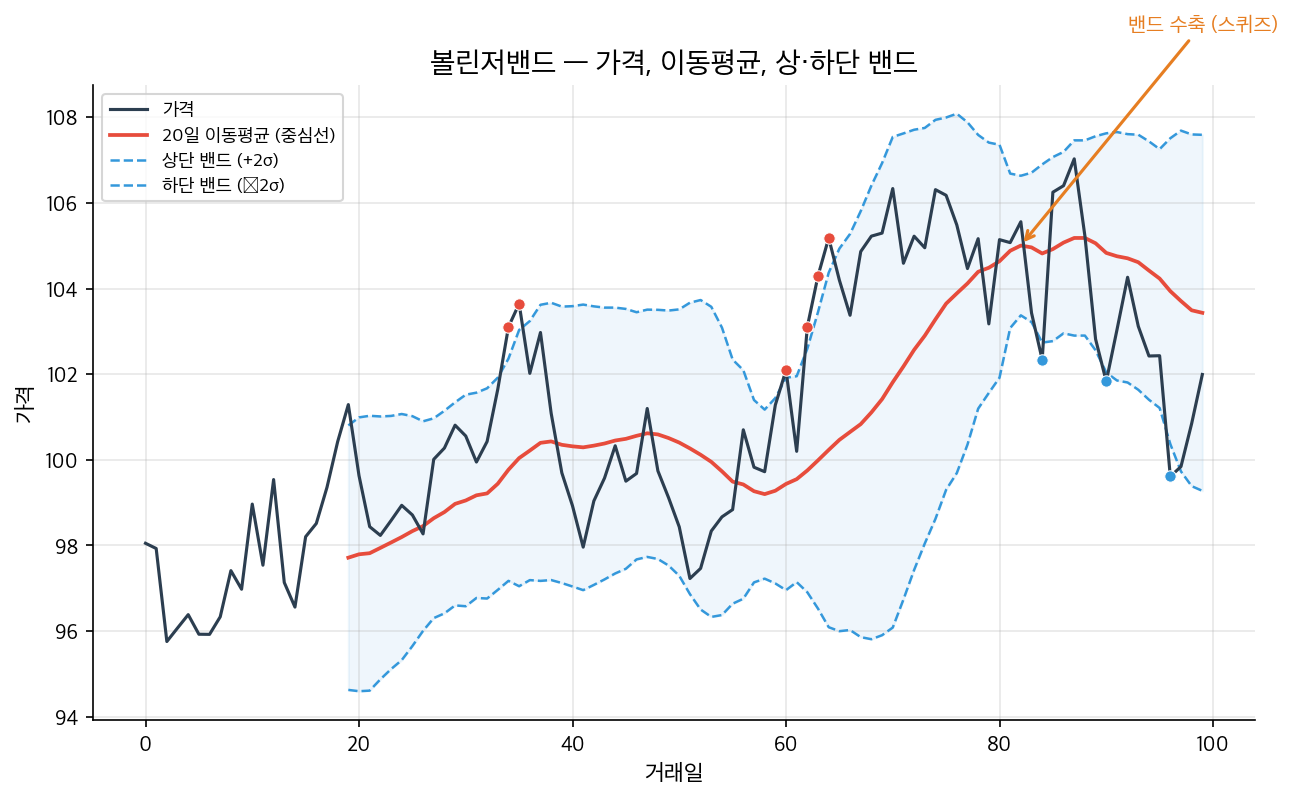
When Bands Narrow (Squeeze)
A narrowing of the bands is called a Squeeze. It indicates reduced volatility, with all three lines close together.
A squeeze often precedes a significant price move. Energy is compressed and then released in a burst when the trend direction is set. However, Bollinger Bands alone cannot predict the direction of the breakout. To determine trend direction, volume and other indicators should be considered.
In practice, monitor when the band width becomes narrower than in recent months. Longer sideways movements tend to produce larger moves when they break out.
When Bands Widen
Band expansion signifies increased volatility, often indicating a strong trend in progress.
Caution is needed: early in band widening, a trend is strengthening and is good for trend-following entries. However, if the bands are already wide, the trend may be nearing its end.
Overbought and Oversold Signals
Initially, you might think “touching the upper band = sell, touching the lower band = buy,” but this is valid only in sideways (ranging) markets.
| Market Condition | Interpretation upon Touching Upper Band |
|---|---|
| Range-bound | Resistance reached, consider selling |
| Strong uptrend | Trend continuation signal; caution against counter-trades |
In strong upward trends, prices often ‘walk the band,’ called Band Walk. Selling just because the upper band is touched during a walk can result in losses, as the trend continues.
Similarly, during a strong downtrend, prices often touch the lower band repeatedly. Buying at the lower band in such cases leads to continued losses.
Key Point: Don’t rely solely on band touches for trading decisions. First, identify if the market is trending or ranging.
Combining Other Indicators
To improve accuracy, Bollinger Bands should be combined with other indicators:
Bollinger Bands + RSI: When the price touches the lower band while RSI < 30 (oversold), the convergence strengthens the oversold signal. Conversely, upper band touch + RSI > 70 confirms overbought conditions.
Bollinger Bands + MACD: During a squeeze, a MACD Golden Cross often signals an upcoming upward move, while a Dead Cross suggests downward momentum.
Bollinger Bands + Volume: After a squeeze, if the bands start widening along with a volume spike, the trend direction is confirmed. Without volume, a band expansion could be false.
Practical Trading Strategy Example
Strategy: Combining Bollinger Band Lower Touch + RSI Divergence
- The price touches the lower band twice in a row
- On the second low, the price makes a lower low while RSI shows a higher low (bullish divergence)
- When the price recovers above the middle line (20-day SMA), enter a buy position
- Stop-loss below the second low
- Target the upper band or previous high
This approach ensures trades only trigger when three signals align (lower band touch, divergence, and crossover), filtering out many false signals.
Cautionary Notes
Limitations of Sole Use: Bollinger Bands are a lagging indicator based on past data. When the bands narrow, volatility has already contracted significantly. They are not predictive tools; combine with others for better signals.
Frame Time Differences: Bollinger Bands on 1-hour and daily charts show different behaviors. A squeeze on a daily chart might already be breaking out on an hourly chart. It’s efficient to set the overall trend on a higher timeframe and refine entry timing on lower timeframes (e.g., 4-hour, 1-hour).
Parameter Adjustments: Default settings (20 periods, 2 SD) are not always optimal. For highly volatile cryptocurrencies, bands might be too wide; for low-volatility assets like ETFs, signals could be overly frequent. Adjust parameters to fit your asset and timeframe.
Recommended Articles
Complete Guide to RSI: Overbought & Oversold signals
Related Posts

Newsletter
Weekly Quant & Market Insights
Get market analysis, quant strategy ideas, and AI & data tool insights delivered to your inbox.
Subscribe →