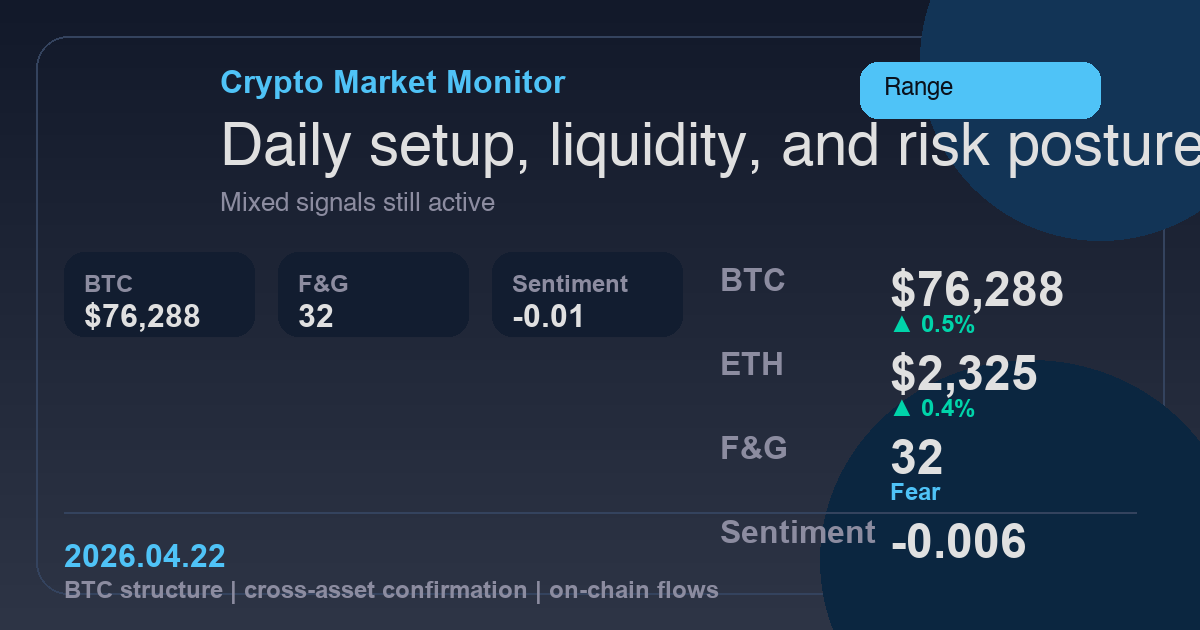
BTC Rebounds as Robust US Retail Sales Boost Market Sentiment on April 22, 2026
US retail sales data exceeded expectations today, strengthening risk appetite while Bitcoin maintains upward momentum near $76,200.
Why this matters today
Strong retail sales indicate economic expansion, encouraging risk appetite.
BTC chart reflects an overall upward trend despite potential short-term correction signaled by harmonic patterns.
On-chain and derivatives funding data confirm relatively balanced selling pressure.
Bitcoin: reading the main chart
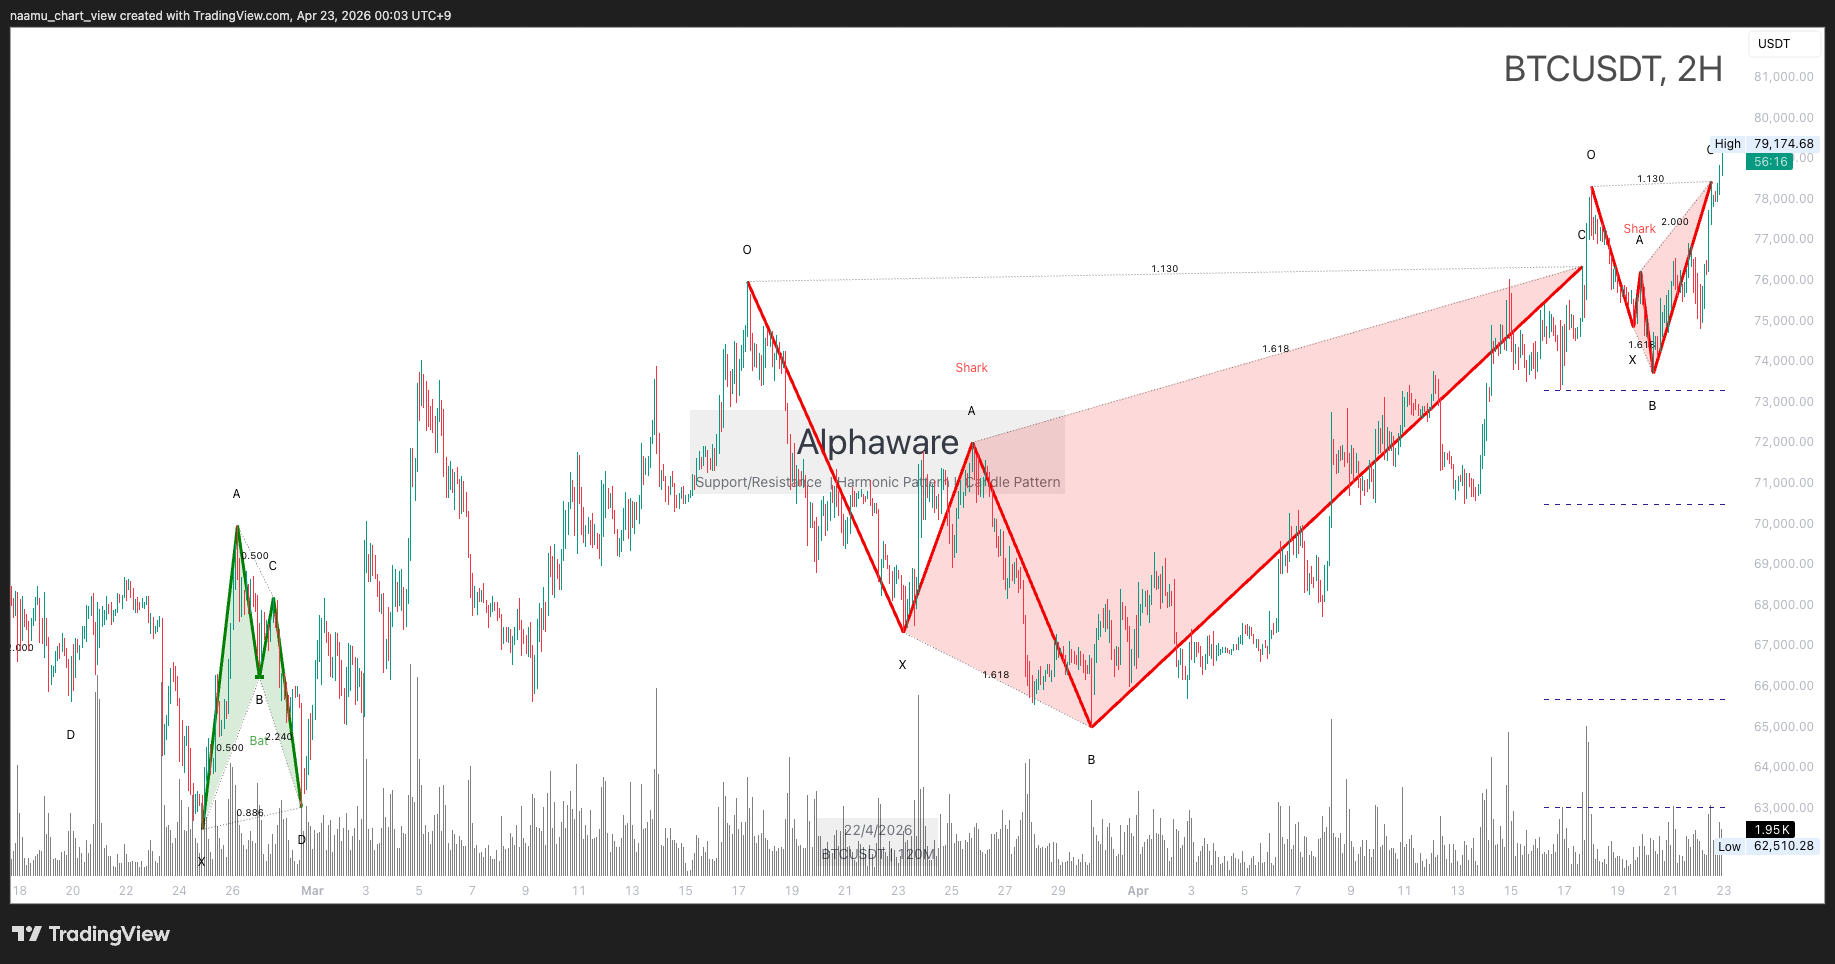
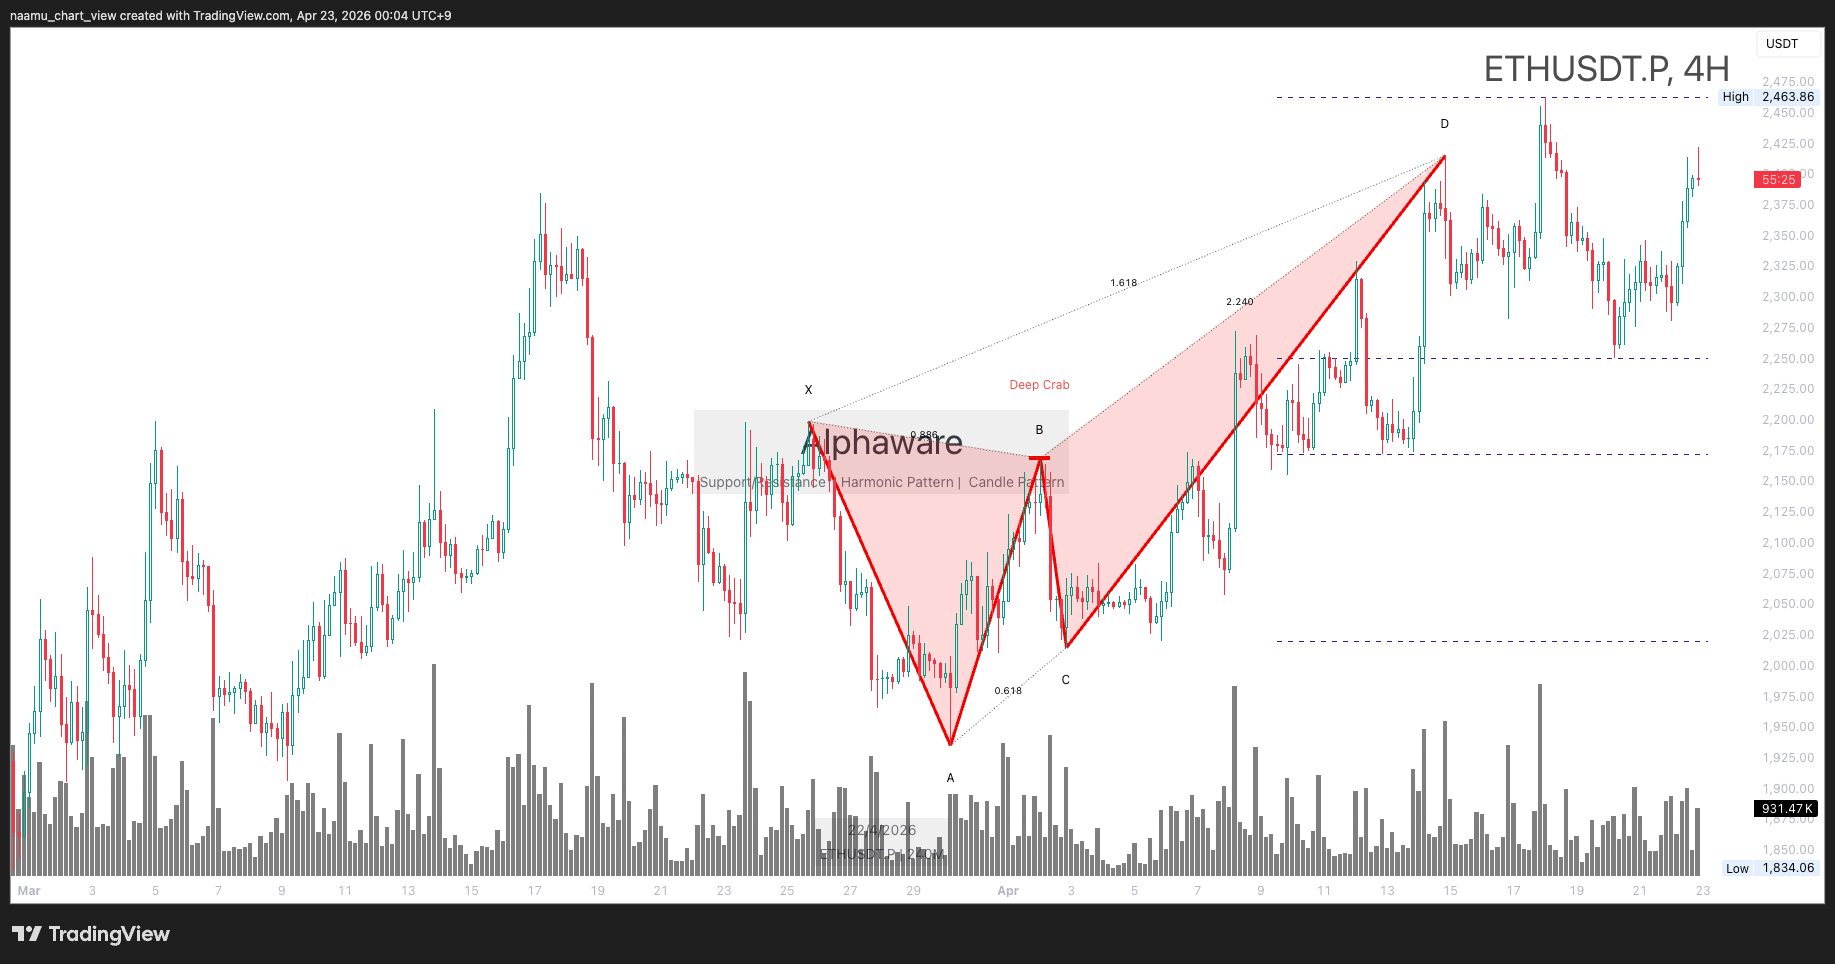
BTC Nears $76K as Uptrend Holds Despite Short-Term Pullback Risk
Bitcoin trades at $76,288, close to the 7-day high range, with positive momentum (+0.0379) sustained by improving economic outlook. While the broader trend remains upward, the Shark harmonic pattern suggests short-term pullback risk that still sits within the larger bullish structure.
Key support levels at $73,000 and $70,000 remain critical for continuation of bullish momentum. Resistance zones at $75,000 may mark battlegrounds for larger price moves.
Investors should monitor these technical levels and view short-term dips as potential buying opportunities given the favorable macro backdrop.
 BTC maintains long-term uptrend with potential short-term correction suggested by Shark pattern; supports at 73,000 and 70,000 remain firm
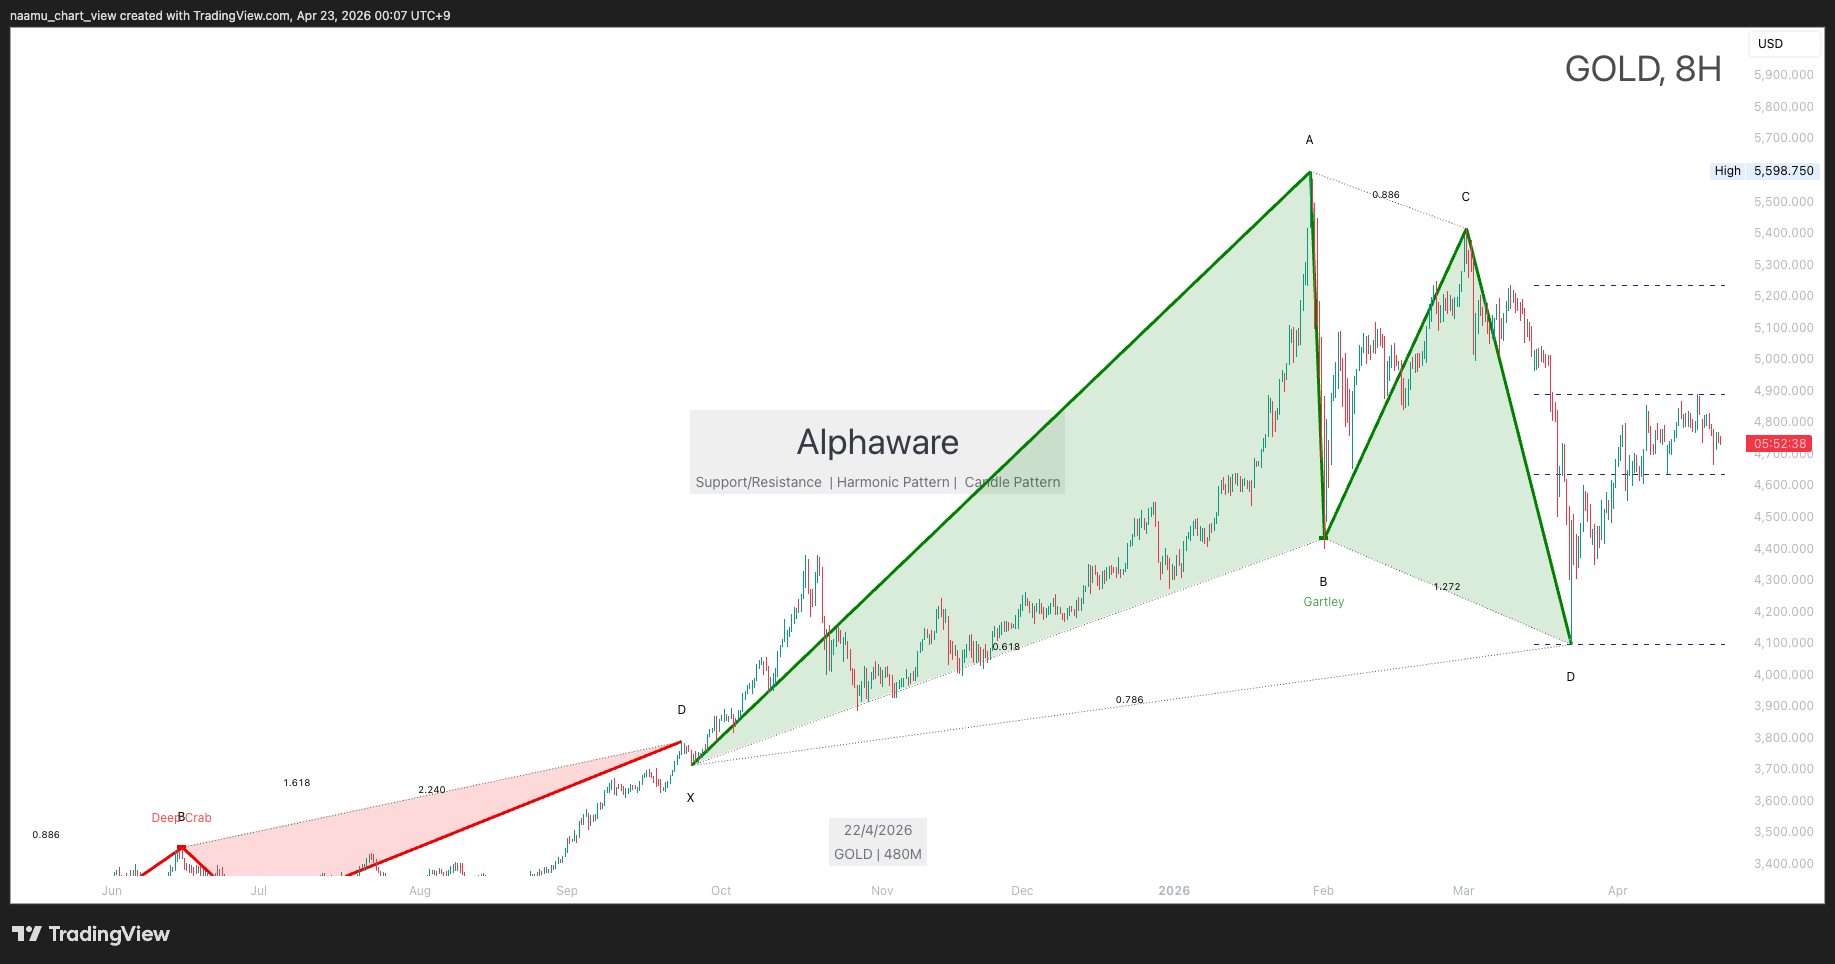
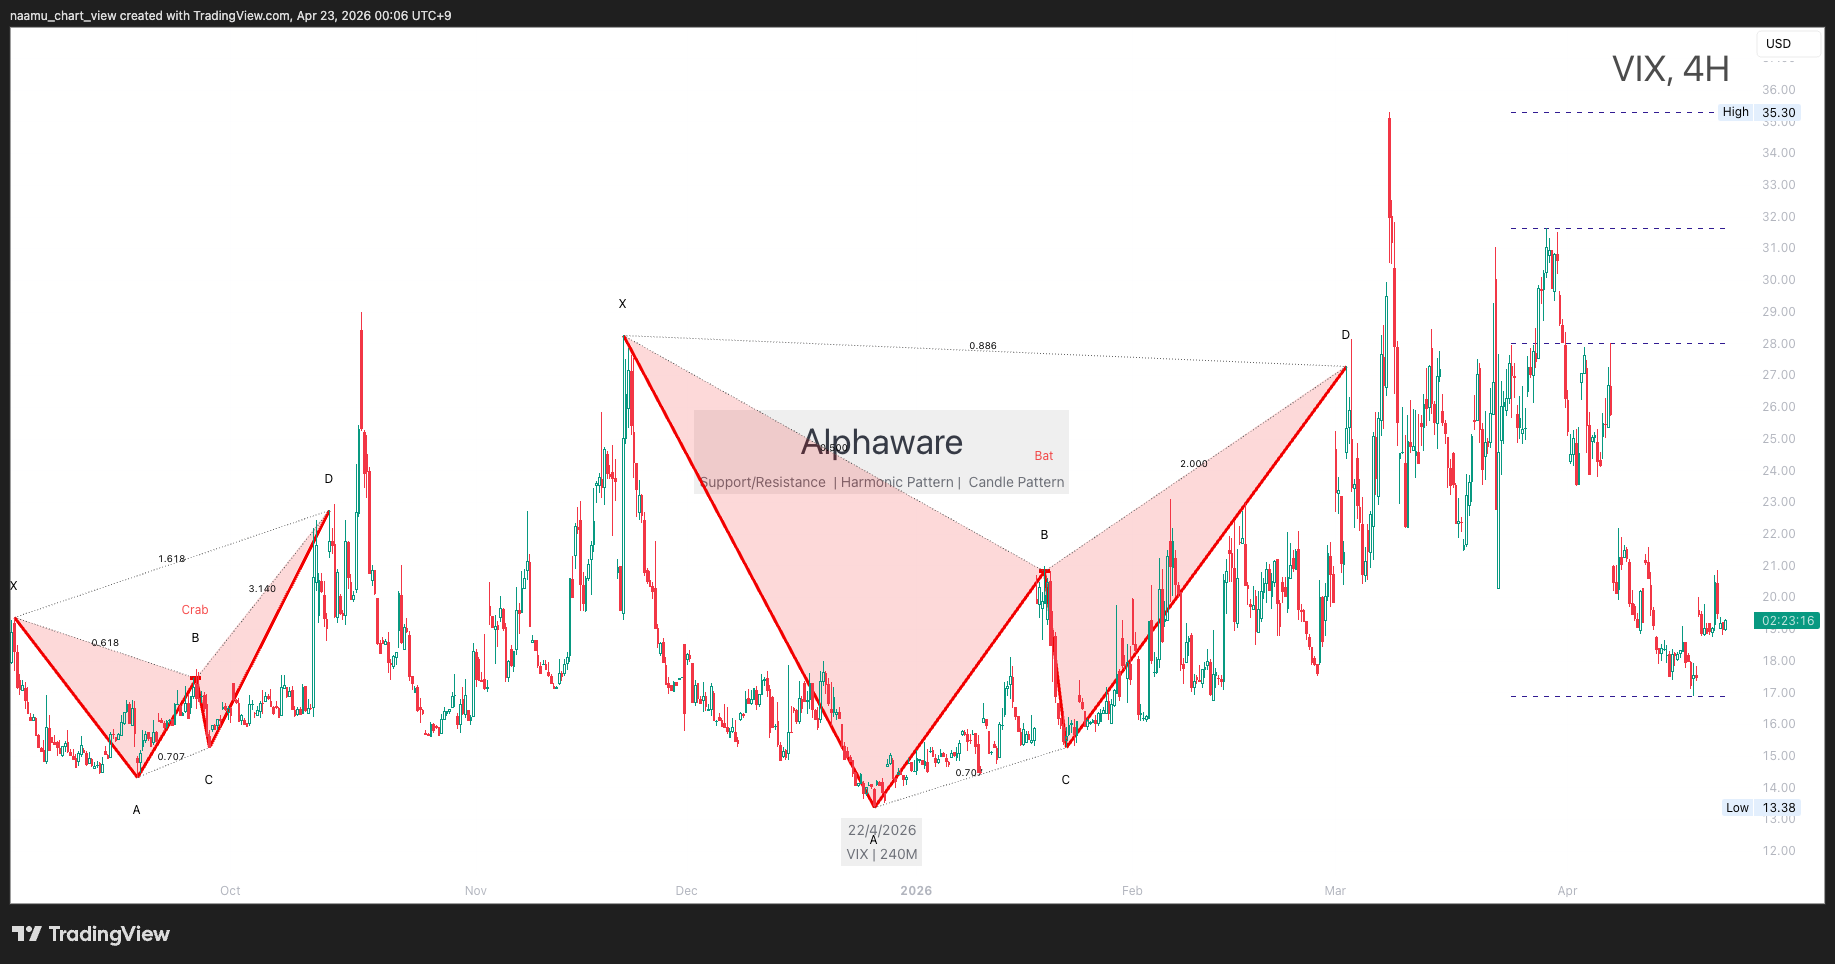
Cross-asset confirmation
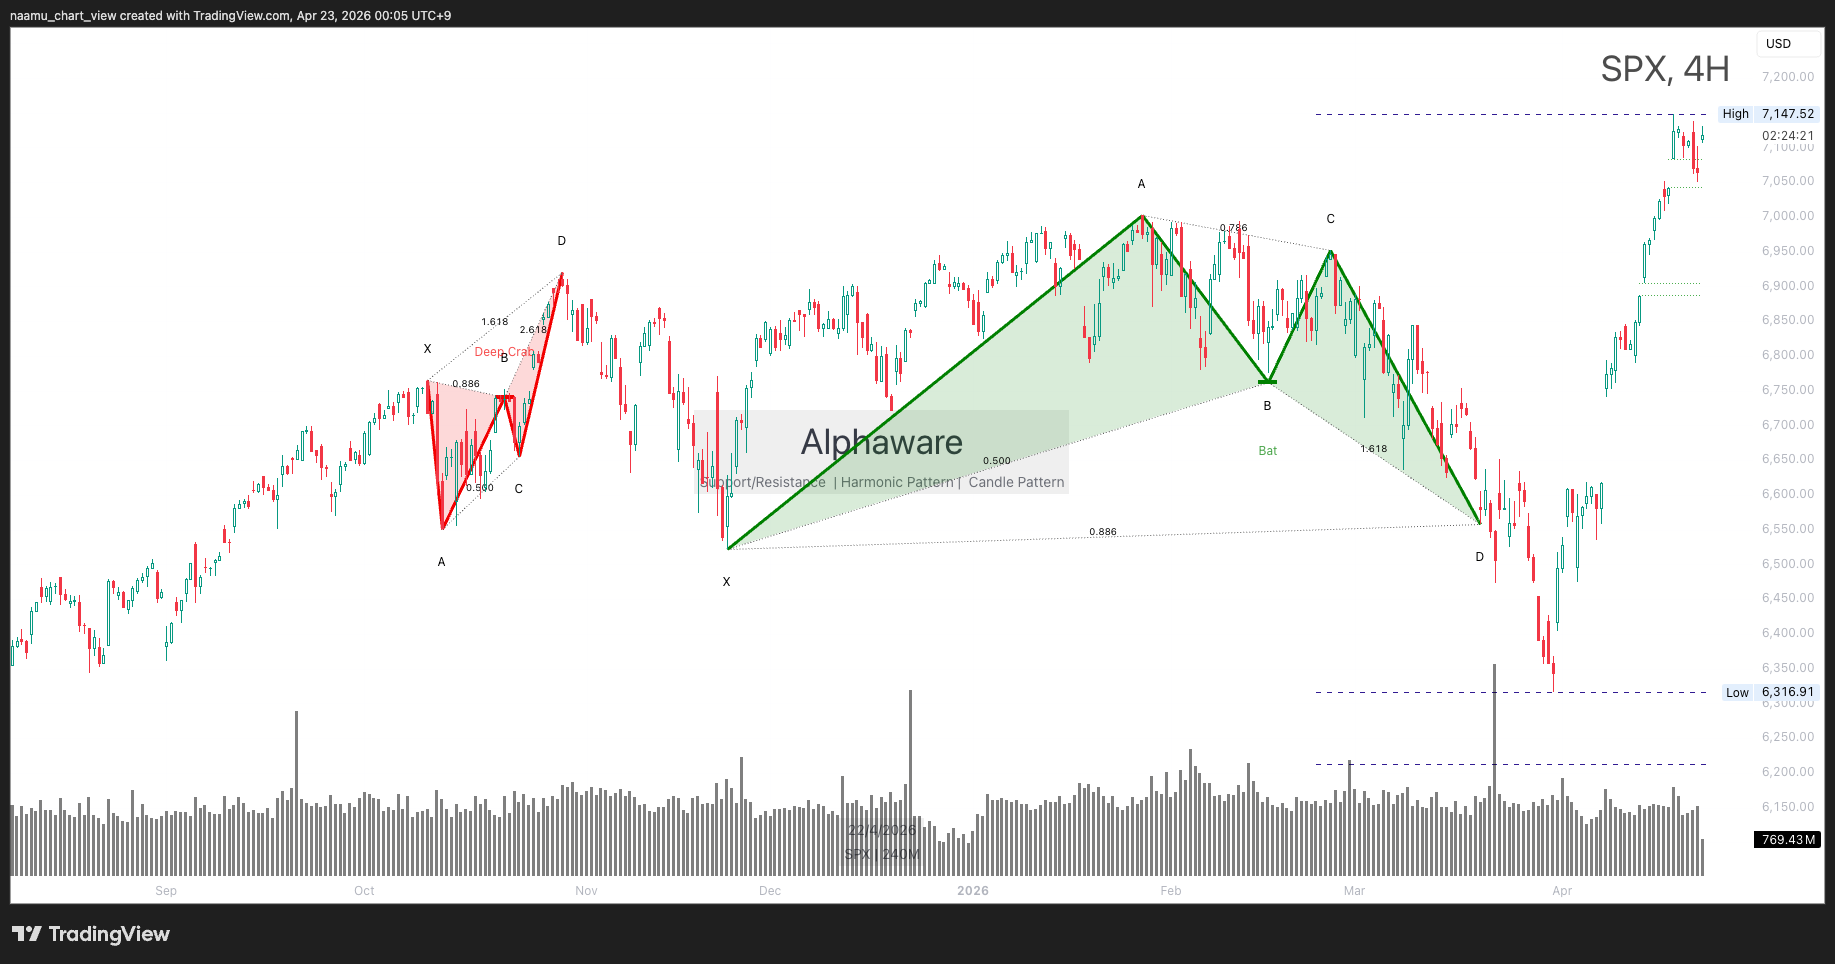
NASDAQ Faces Correction Amid Fund Flows to International Markets
NASDAQ remains in a correction phase as Bank of America reports investors shifting capital abroad, reflecting mixed US equity appeal.
Such international fund flows may indirectly benefit cryptocurrencies, helping maintain BTC’s positive momentum despite NASDAQ weakness.
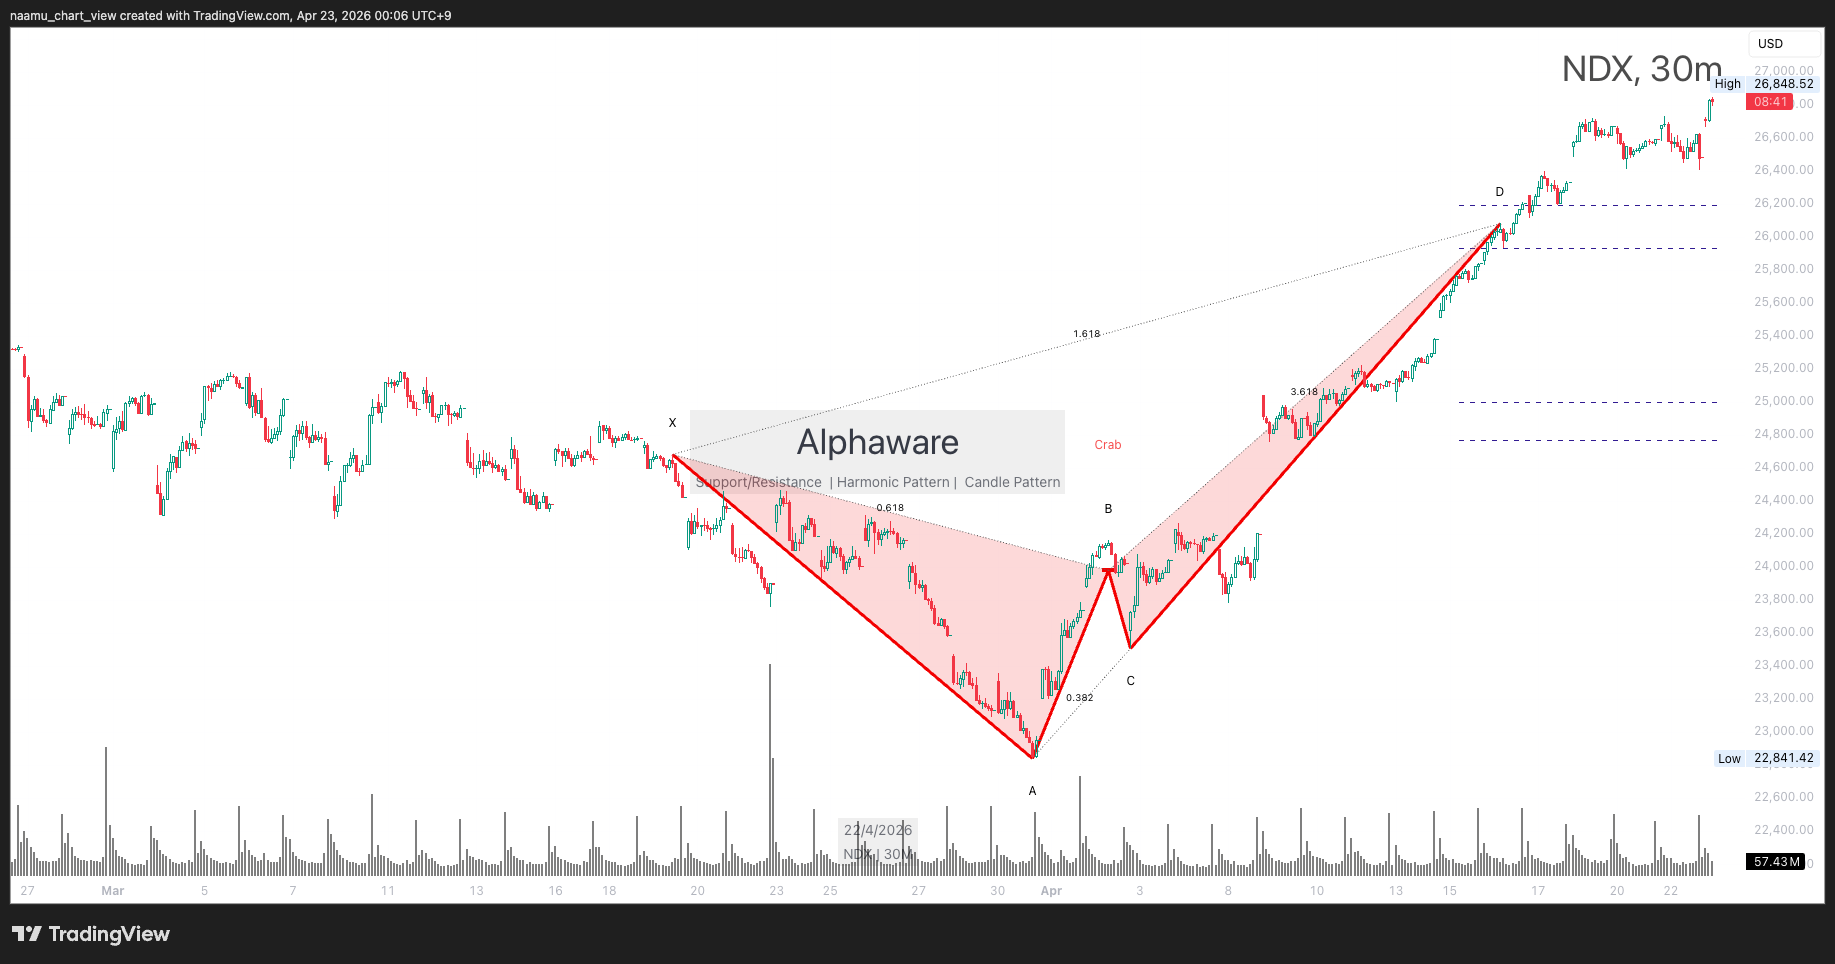 NASDAQ enters correction phase alongside fund flows shifting towards international markets
Macro and major headlines
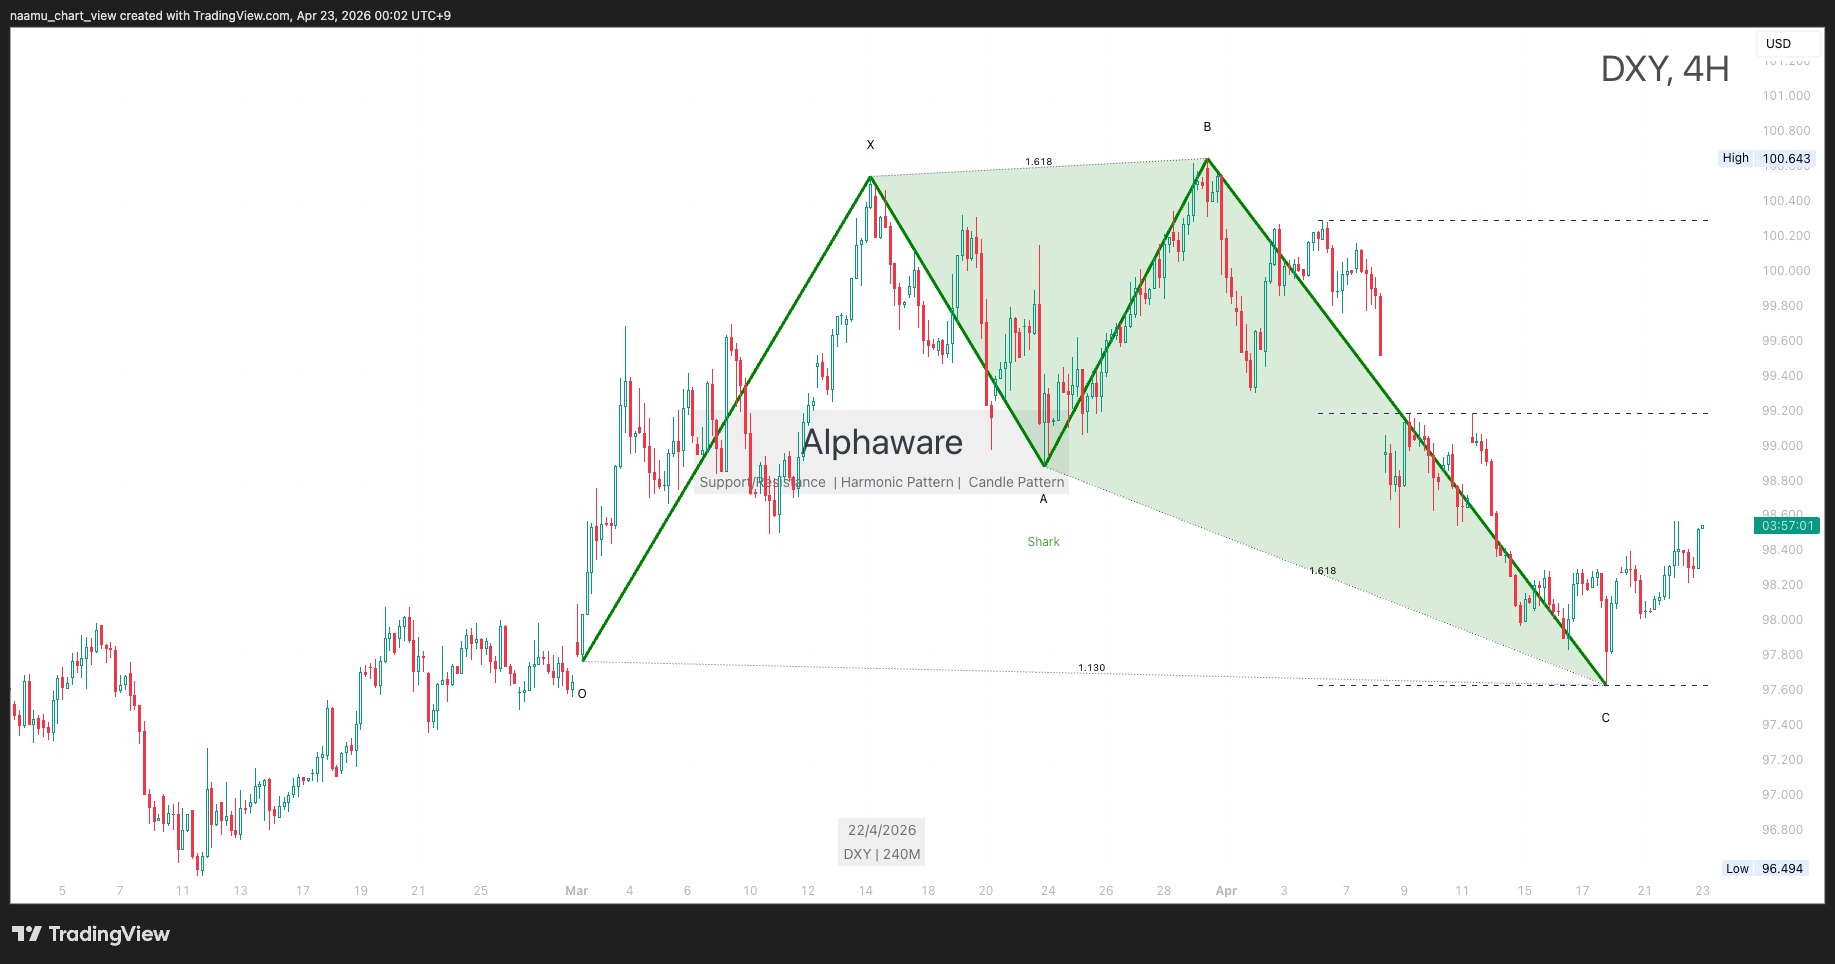
US Retail Sales Strength Influences Dollar and Risk Asset Dynamics
US retail sales grew 1.4% month-over-month, matching forecasts and signaling economic resilience. Core retail sales also rose 1.4%, reinforcing consumer spending strength.
These results could strengthen the US dollar, although the DXY index currently shows steady to mild gains without sharp moves.
As liquidity conditions remain balanced, risk assets like BTC stand to benefit from increased investor confidence.
| Indicator | Current read | Market implication |
|---|---|---|
| BTC Price | $76,288 near 7-day high range | Maintains bullish momentum with possible short-term correction |
| US Retail Sales | 1.4%, beating or matching expectations | Supports risk appetite |
| NASDAQ | Correction phase with international fund flows | Partial US equity outflow, indirect crypto impact |
Summary of key indicators and market impacts
Economic calendar and FOMC watch
Key Economic Event: US Retail Sales Release
US retail sales and core retail sales both met or exceeded expectations at 1.4%, bolstering market optimism.
The data impacts dollar-risk asset dynamics, with particular relevance to Bitcoin’s price action.
Markets monitor how this consumer data influences policy views and liquidity (source: Forex Factory).
-
[GBP] Claimant Count Change — forecast 22.6, previous 24.7
-
[USD] Retail Sales m/m — forecast 1.4%, previous 0.6%
-
[USD] Core Retail Sales m/m — forecast 1.4%, previous 0.5%
-
[USD] Fed Chairman-Designate Warsh Testifies — forecast N/A, previous N/A
-
[GBP] CPI y/y — forecast 3.3%, previous 3.0%
-
The next FOMC meeting is scheduled for 2026-04-28 to 2026-04-29 ET.
-
For Korea time, the main reaction window is likely the early hours of 2026-04-30.
Collected news and high-impact events
News Highlights: Geopolitical Risks and Capital Flows
Bank of America reported a capital outflow from US equities to international markets, indicating a shift in investor preferences.
Geopolitical tensions involving drone strikes in the Middle East may increase short-term volatility, though direct crypto market impact appears limited.
Blockchain ecosystem developments include RedotPay’s integration of $SUI and USDC-Sui, expanding stablecoin linked services.
On-chain and derivatives
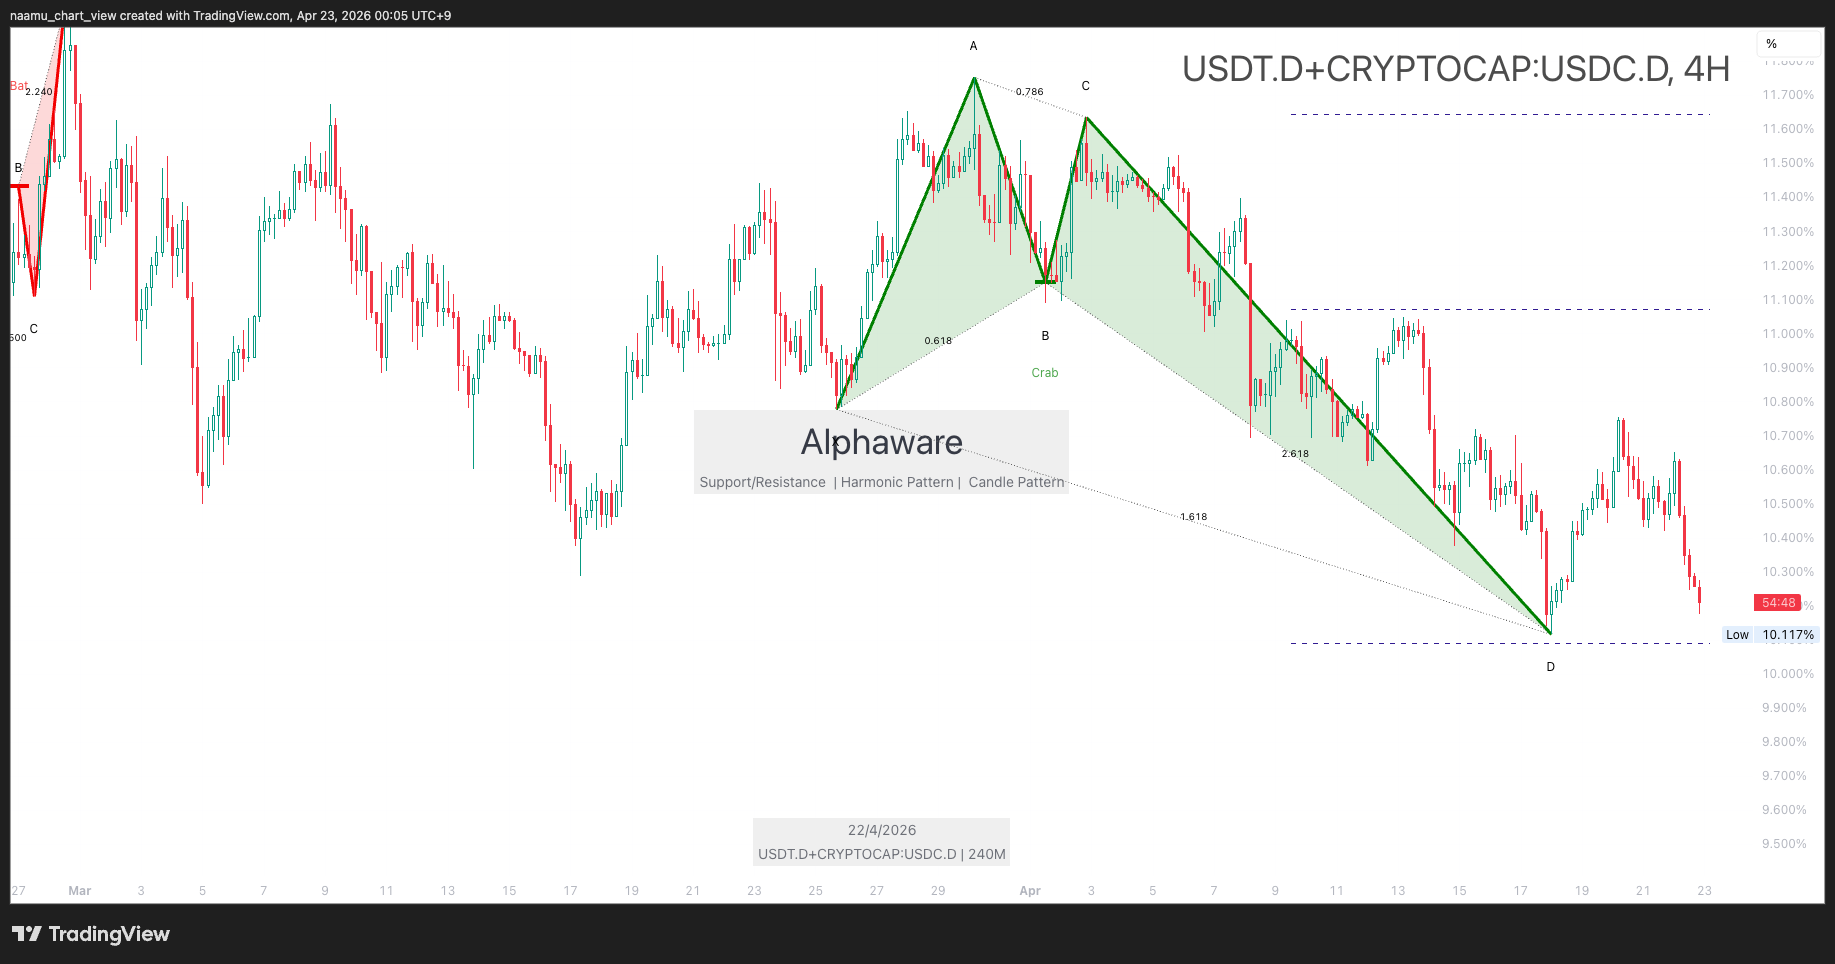
USDTD_USDCD Chart Indicates Eased Spot Selling Pressure
USDTD_USDCD data shows recent outflows, signaling a reduction in spot selling pressure. On-chain funding rates and derivative flows remain stable.
This supports constructive capital flow for BTC and the broader crypto market, complementing price momentum.
Monitoring these dynamics can provide early insight into potential price rebounds.
 USDTD_USDCD outflow signals easing spot sell pressure and strengthened BTC capital inflows
Additional chart checks
Extra captures used during review are grouped here so the published post does not hide them.
Near-term scenarios
Base case
Strong US retail sales reinforce economic growth expectations and liquidity, supporting BTC’s bullish momentum above key supports despite possible short-term corrections.
Alternative case
If the current pullback risk expands and key support levels fail, BTC could face a deeper correction; however, stable funding and improving capital flows may soften that downside.
Checklist
-
Verify US retail and core retail sales outcomes
-
Monitor BTC key supports and resistances
-
Track NASDAQ correction and global fund flow trends
-
Watch USDTD_USDCD for on-chain capital flow signals
Related reads
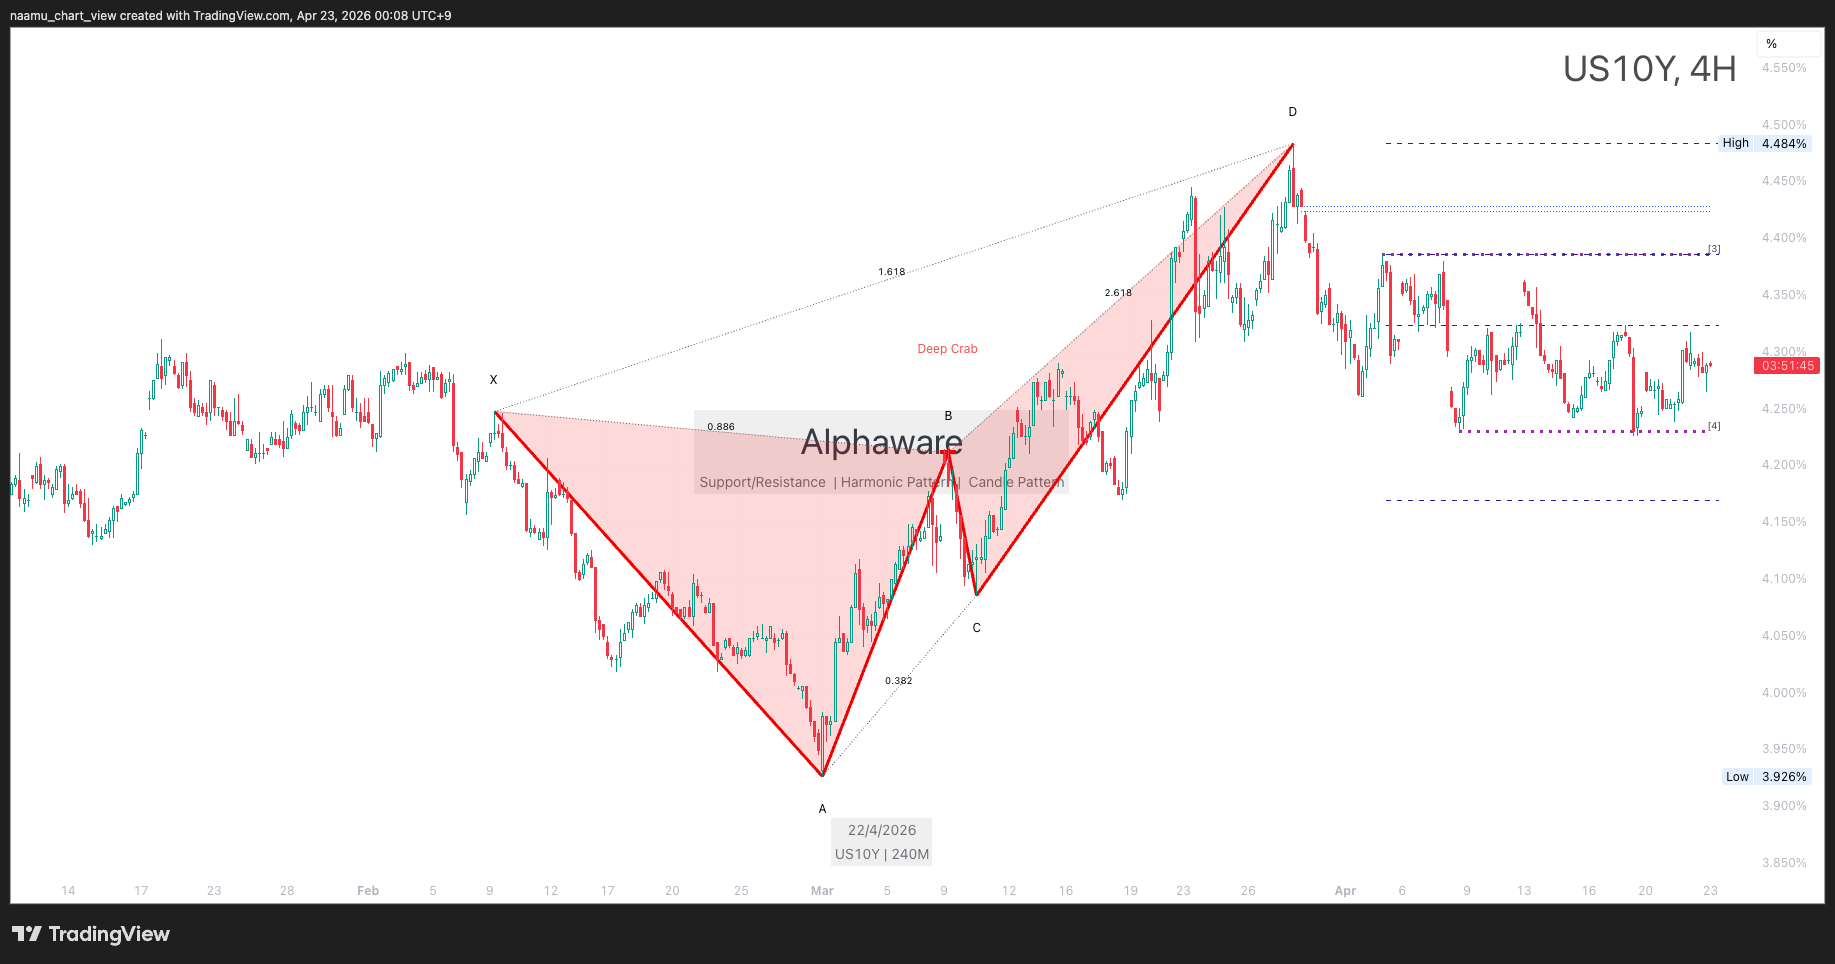
2026년 04월 20일 암호화폐 시장 분석 Reading crypto capital flows with USDT.D How US10Y yields affect Bitcoin
FAQ
How does retail sales data affect BTC?
Stronger consumer spending boosts economic growth expectations, encouraging risk appetite that tends to support BTC price appreciation.
What significance does the Shark pattern hold?
It signals possible short-term selling pressure and correction, but as long as key supports hold, the overall uptrend remains intact.
What does USDTD_USDCD outflow mean?
It indicates a reduction in spot selling pressure, suggesting bullish capital flow conditions for the crypto market.
Related Posts

Newsletter
Weekly Quant & Market Insights
Get market analysis, quant strategy ideas, and AI & data tool insights delivered to your inbox.
Subscribe →