Bitcoin Holds 67K Range as Mixed DXY Signals Collide With Fear
Exchange outflows offered support, but DXY uncertainty and weak macro sentiment kept direction muddy. April 5 was a range-bound session defined by conflicting signals rather than conviction.
Why this matters today
BTC’s sideways trend and DXY’s mixed patterns obscure clear directional signals for the market.
On-chain data (exchange net outflows) is positive, but macro sentiment (-0.103) and ETF outflows act as negative factors.
High-impact events (regulatory improvements and geopolitical risks) conflict, increasing market volatility.
Bitcoin: reading the main chart
BTC Consolidates at 67K, $72K Resistance Breakout Key for Short Term
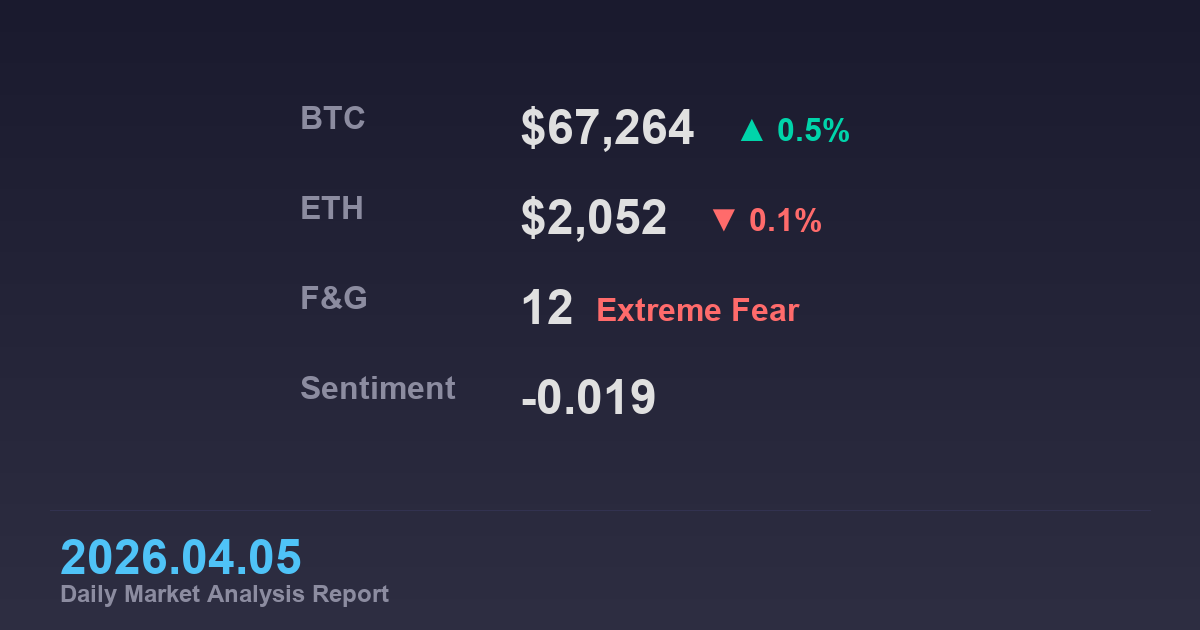
Bitcoin is currently around $67,264, showing a sideways trend on the 4-hour chart within a $62,000–$72,000 range. Key support lies near $62,000 and $64,000, while resistance is at $72,000 and $80,000, making short-term direction dependent on a breakout above $72,000.
Chart analysis reveals Shark and XABCD patterns, but no valid harmonic patterns provide clear directional signals. This suggests the market is awaiting a catalyst, with the current price in the middle of its 7-day range ($65,801–$68,284).
The momentum indicator (+0.0163) shows a faint positive signal, but the Fear & Greed Index at 12 (Extreme Fear) reflects highly cooled sentiment. Low funding rates (BTC 0.0024%) indicate no overheating in derivatives, yet this also signifies strong wait-and-see attitudes.
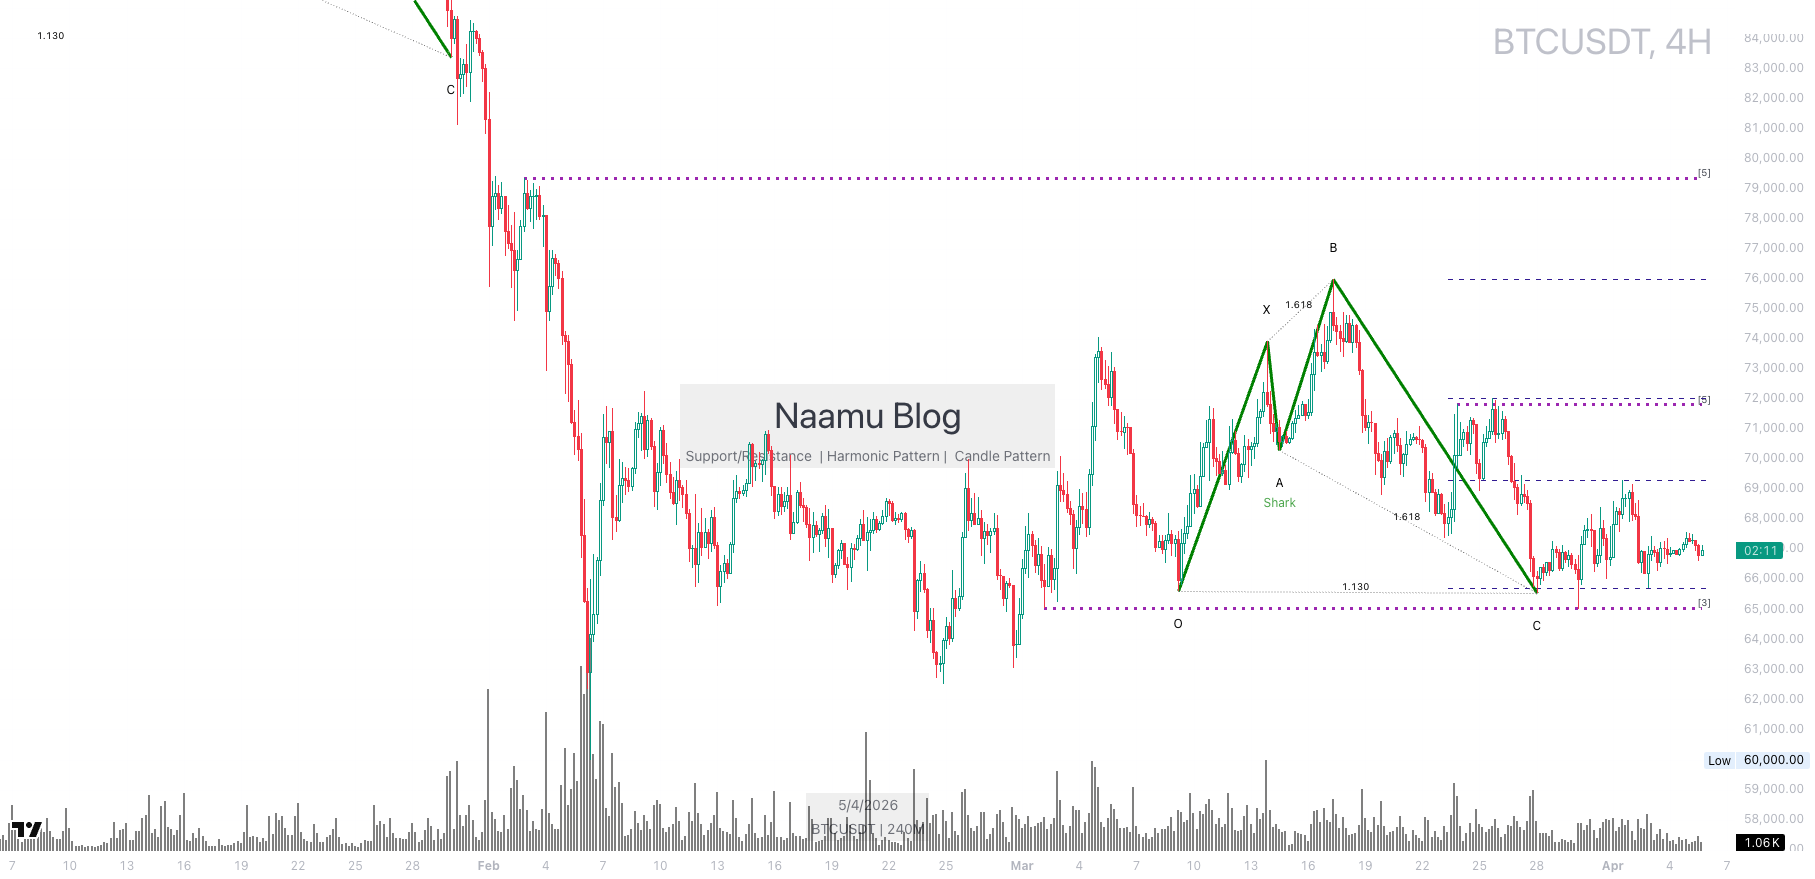 BTC consolidates at $67,264, with a breakout above $72,000 resistance key for short term. Shark and XABCD patterns are noted, but clear direction is lacking.
Cross-asset confirmation
DXY Mixed Patterns Add Uncertainty to BTC
The DXY (Dollar Index) daily chart displays a sideways trend with mixed signals from XABCD (bearish) and Bat (bullish) patterns. Key resistance is at 101.100 and the 99.900–100.500 zone, while support is at 95.551 and 96.500, leaving dollar direction unclear.
DXY’s uncertainty may indirectly pressure Bitcoin, as dollar strength typically weighs on crypto, but mixed patterns could limit this effect. ETH is around $2,052 with a slight decline (-0.1%), but further downside appears limited given global market linkages.
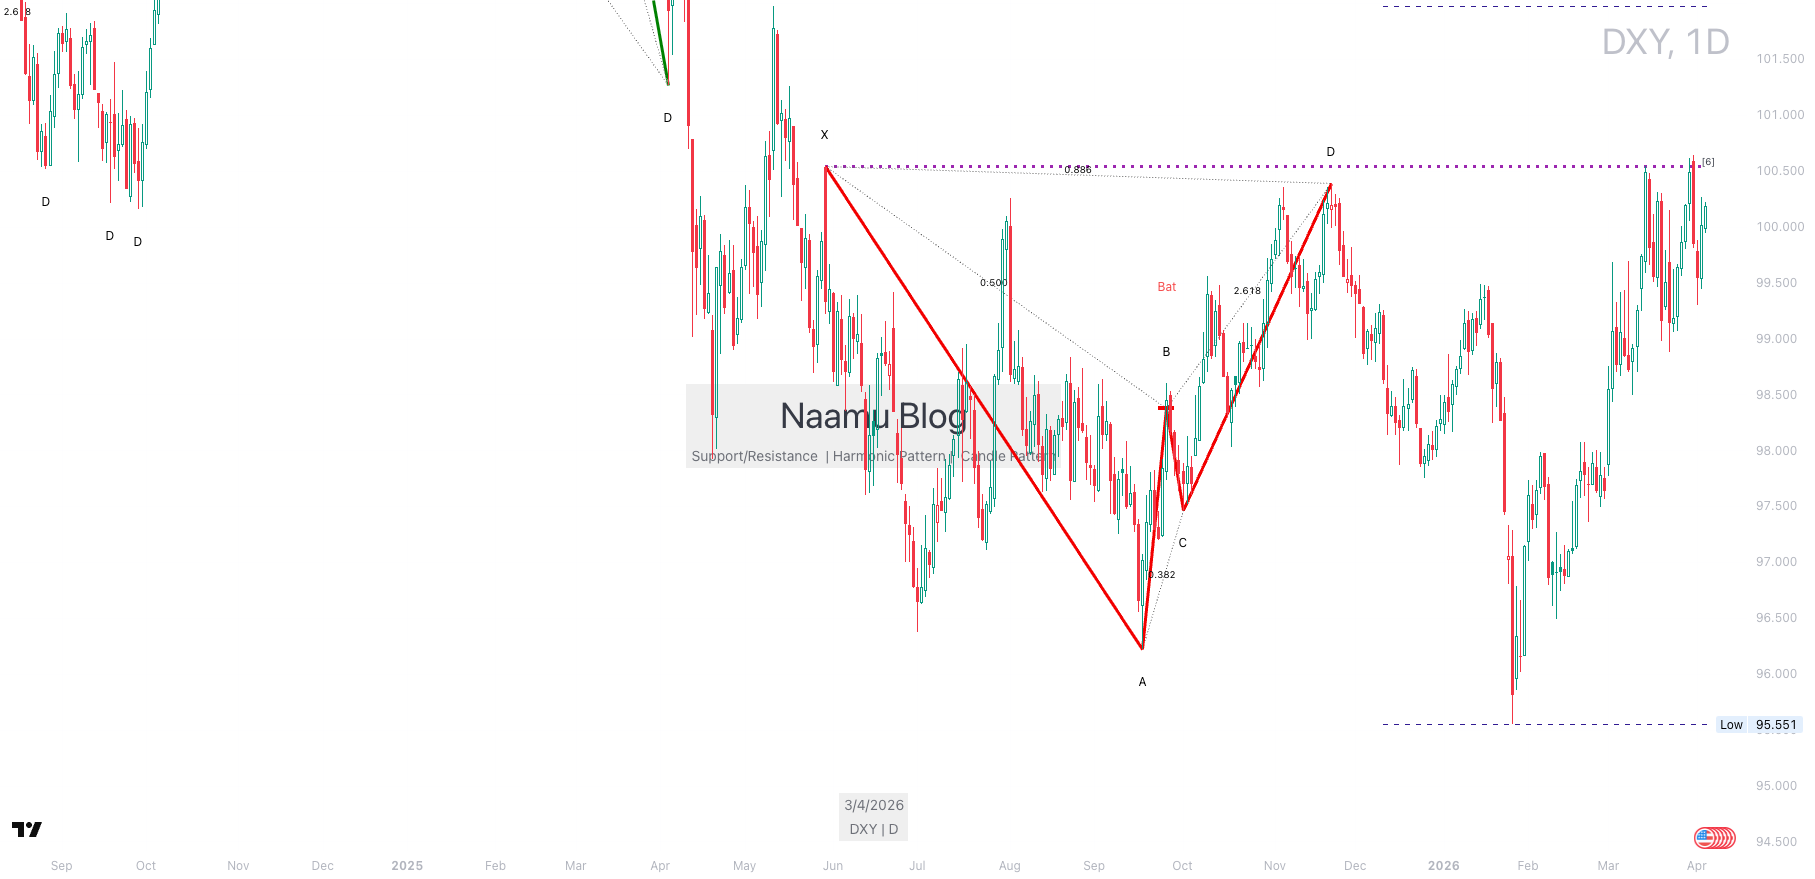 DXY shows mixed XABCD (bearish) and Bat (bullish) patterns, clouding dollar direction and adding indirect uncertainty to BTC.
Macro and major headlines
Regulatory Improvements Coexist with Geopolitical Risks
The macro environment presents conflicting signals. Positively, the U.S. Department of Labor’s proposal to open $10 trillion in 401k plans to crypto (scale 8, bullish) suggests long-term demand growth. Conversely, news of attacks in Kuwait (scale 7, bearish) heightens global risks and could spur volatility.
News sentiment analysis shows an overall -0.019 bias, with macro sentiment at -0.103 and worsening. This indicates investor focus on geopolitical unrest. In financial markets, SPX shows bullish signals, but direct correlation with crypto may be limited.
Among high-impact events, Bitcoin miners shifting to AI (scale 6, bearish) hints at supply-side pressure, though short-term impact is likely constrained. These mixed macro signals make it difficult for the market to move decisively in one direction.
| Indicator | Current read | Market implication |
|---|---|---|
| BTC Price | $67,264 (+0.5%), consolidating in 7-day range $65,801–$68,284 | Neutral: Lack of clear trend requires directional confirmation |
| Exchange BTC Net Outflow | -18,057 BTC (7-day), signals eased spot selling pressure | Positive: Potential for strengthened long-term holding sentiment |
| Fear & Greed Index | 12 (Extreme Fear), market sentiment highly cooled | Negative: Rebound opportunities exist but require cautious approach |
Table data is based on real-time values as of April 5, 2026, reflecting mixed market signals.
On-chain and derivatives
On-Chain Outflows Ease vs ETF Fund Outflows
On-chain data shows exchange BTC net outflows of -18,057 BTC (7-day), indicating eased selling pressure in the spot market. This can be interpreted as an accumulation phase, a positive long-term signal. However, BTC ETF net inflows are -$214, reflecting continued short-term fund outflows and institutional wait-and-see attitudes.
On the derivatives side, low funding rates (BTC 0.0024%, ETH 0.0000%) show no leverage overheating, but this also means low market participation. The USDTD 4h USDCD chart provides auxiliary insight into stablecoin flows, with no clear trend evident in current data. Overall, on-chain acts as a buffer, while derivatives and ETF flows pose headwinds.
Event counts show high whale (443) and regulation (277) activities, suggesting significant impacts from large investor moves and regulatory trends. However, specific whale movements were not captured in the provided data feed, requiring further verification.
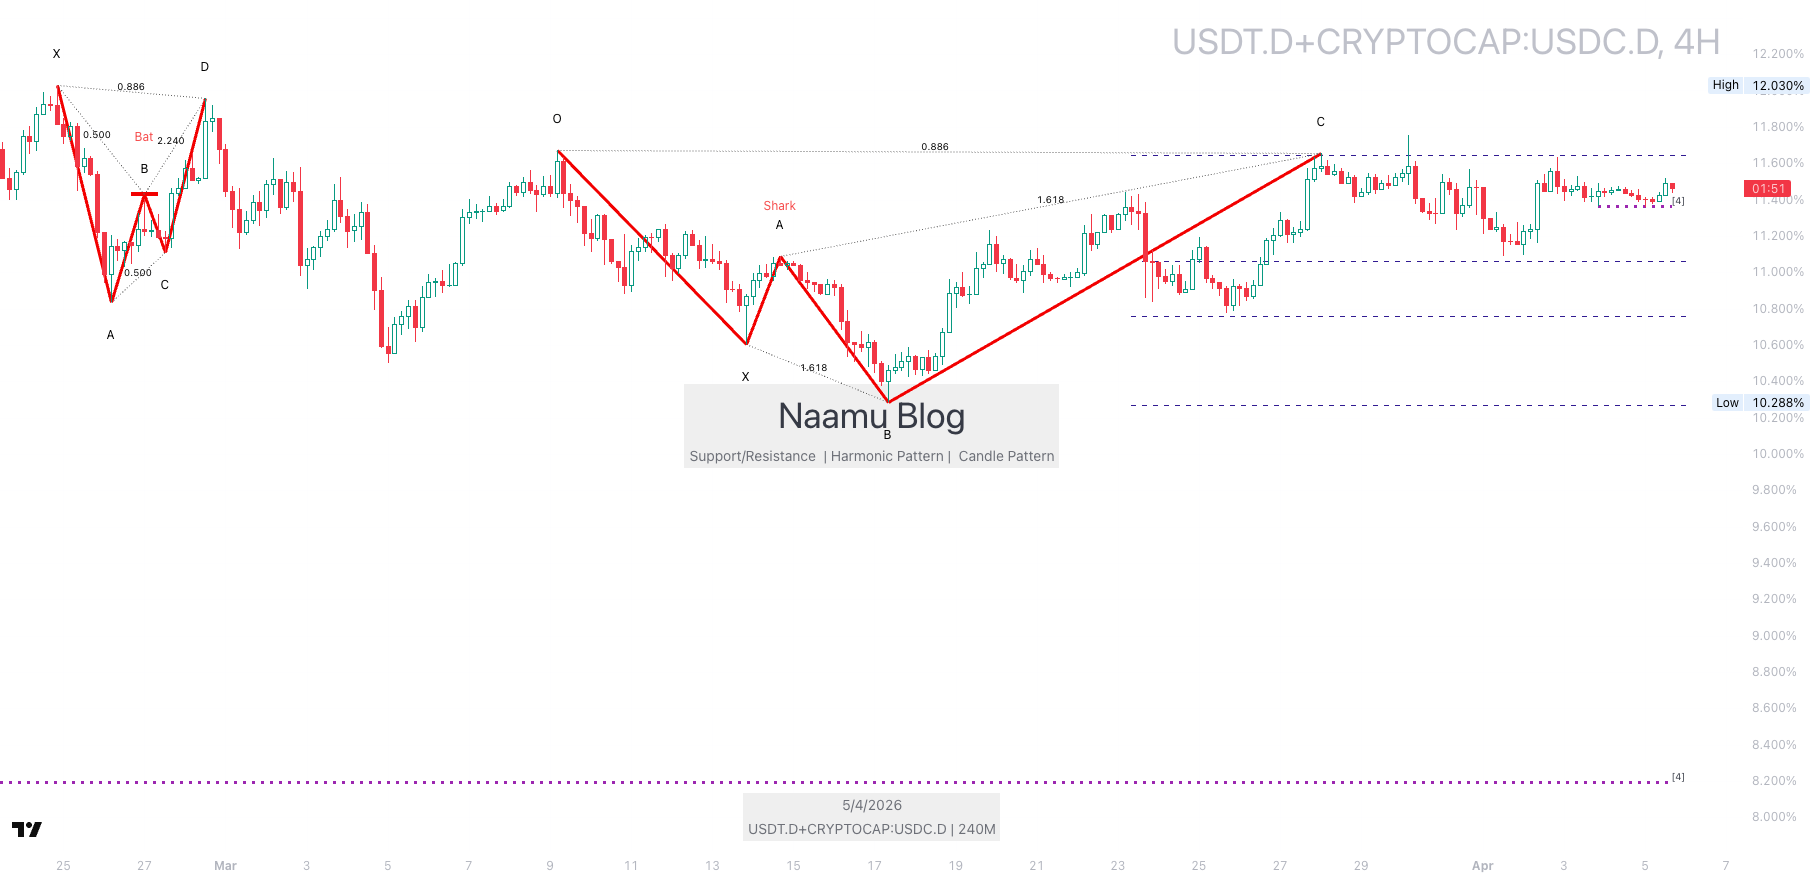 The USDTD chart shows stablecoin trends, with no clear trend in current data. It contrasts with on-chain net outflows and ETF outflows.
Near-term scenarios
Base case
If BTC continues consolidating in the $67,000 range with DXY mixed patterns and exchange net outflows maintaining conflicting signals, the market will likely show volatility within the $62,000–$72,000 range. A failure to break above $72,000 resistance could lead to a retest of the downside.
Alternative case
If high-impact regulatory news (401k opening) triggers positive sentiment and BTC breaks above $72,000 resistance, short-term upward momentum may emerge. Conversely, escalating geopolitical risks could strengthen downward pressure, testing the $62,000 support level.
Checklist
- Monitor BTC’s breakout above $72,000 resistance
- Confirm DXY pattern direction (test of 101.100 resistance or 95.551 support)
- Track ongoing exchange net outflows and ETF fund flows
- Watch market reactions to high-impact events (regulation, geopolitics)
Related reads
How to read DXY-Bitcoin correlation A guide to reading BTC funding rates Reading the market with on-chain data
FAQ
Why is Bitcoin consolidating at $67,000?
Conflicting signals from DXY mixed patterns, coexisting exchange net outflows easing sell pressure and ETF outflows, and extreme fear sentiment are hindering clear direction. The market is in a wait-and-see mode for catalysts.
Are exchange net outflows a positive signal?
Yes, exchange net outflows (-18,057 BTC, 7-day) suggest eased selling pressure in the spot market, potentially strengthening long-term holding sentiment. However, combined with ETF outflows, short-term impact may be limited.
What does the Fear & Greed Index of 12 (Extreme Fear) indicate?
It shows highly cooled market sentiment, which could present rebound opportunities. However, this indicator alone is insufficient for short-term direction prediction and should be interpreted alongside other data.
Related Posts
Newsletter
Weekly Quant & Market Insights
Get market analysis, quant strategy ideas, and AI & data tool insights delivered to your inbox.
Subscribe →