Bitcoin Holds 69K Range as Fear Index 11 Sets Up Three Rebound Checks
Even with extreme fear dominating sentiment, exchange outflows, neutral funding, and improving momentum kept a rebound case alive. The key variable on April 7 remained whether dollar strength would override those supports.

Why this matters today
DXY’s bullish reversal pattern foretells dollar strength, potentially pressuring Bitcoin downward.
Exchange net outflows and ETF inflows suggest accumulation by long-term holders, adding liquidity to the market.
Rising momentum amid fear sentiment and neutral funding rates indicate conditions are set for a potential short-term rebound.
Bitcoin: reading the main chart
69K Support Defense, 77K Resistance as Short-Term Inflection Point
Bitcoin is currently around $68,937, showing a sideways trend near the top of its 7-day range ($66,794 – $69,588). Technically, the 4-hour chart explicitly displays a Shark harmonic pattern hinting at a bullish reversal, but this should be used as supplementary evidence.
The key is the battle between major support and resistance levels. Downside supports act at $69,000, $66,000, and $64,000, while upside resistances are positioned at $73,000 and $77,000. Particularly, $77,000 is a strong psychological resistance, and a break above could serve as a short-term upside trigger.
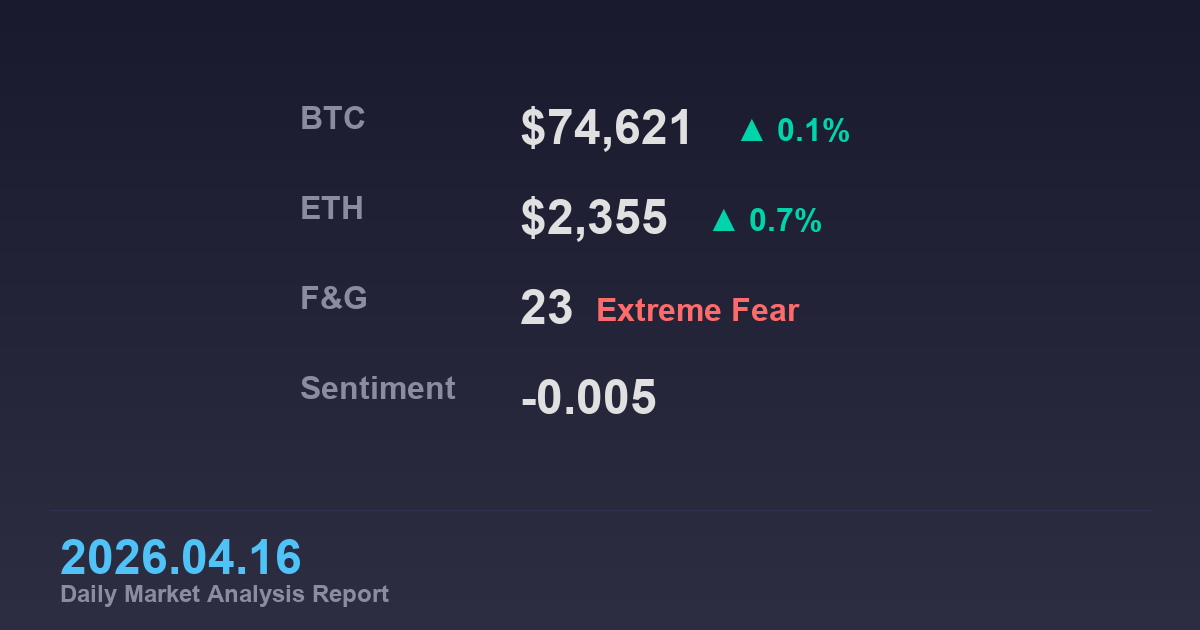
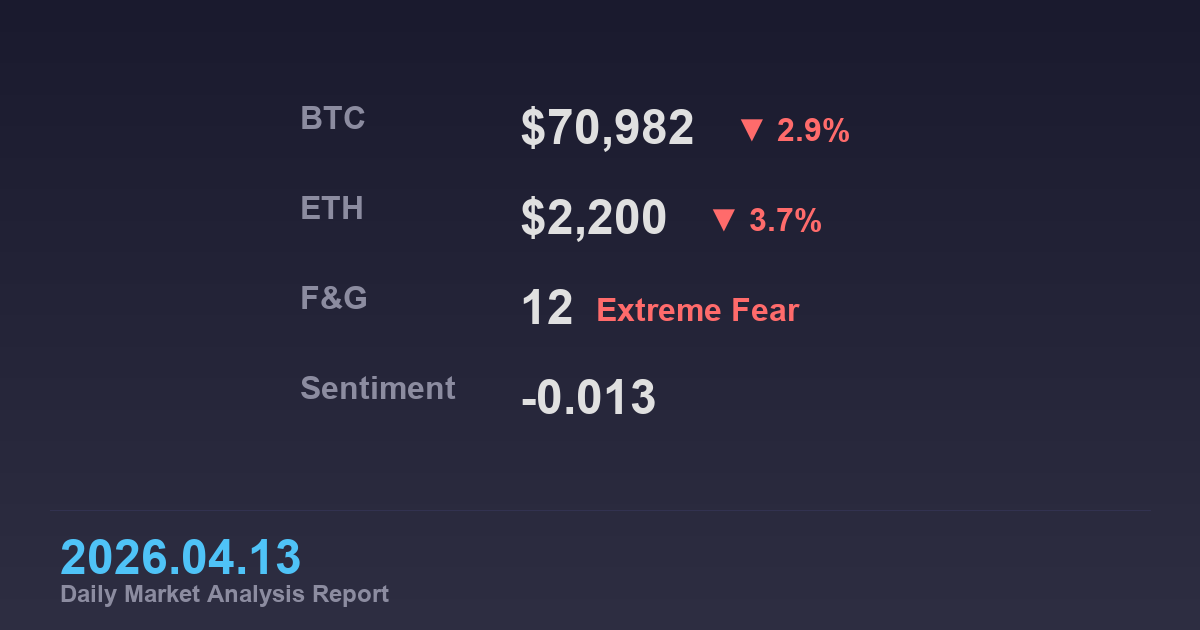
The Fear & Greed Index at 11 (Extreme Fear) reflects extreme fear sentiment, but momentum +0.0653 shows an upward tilt. This suggests the market has a technical foundation for a rebound from oversold conditions.
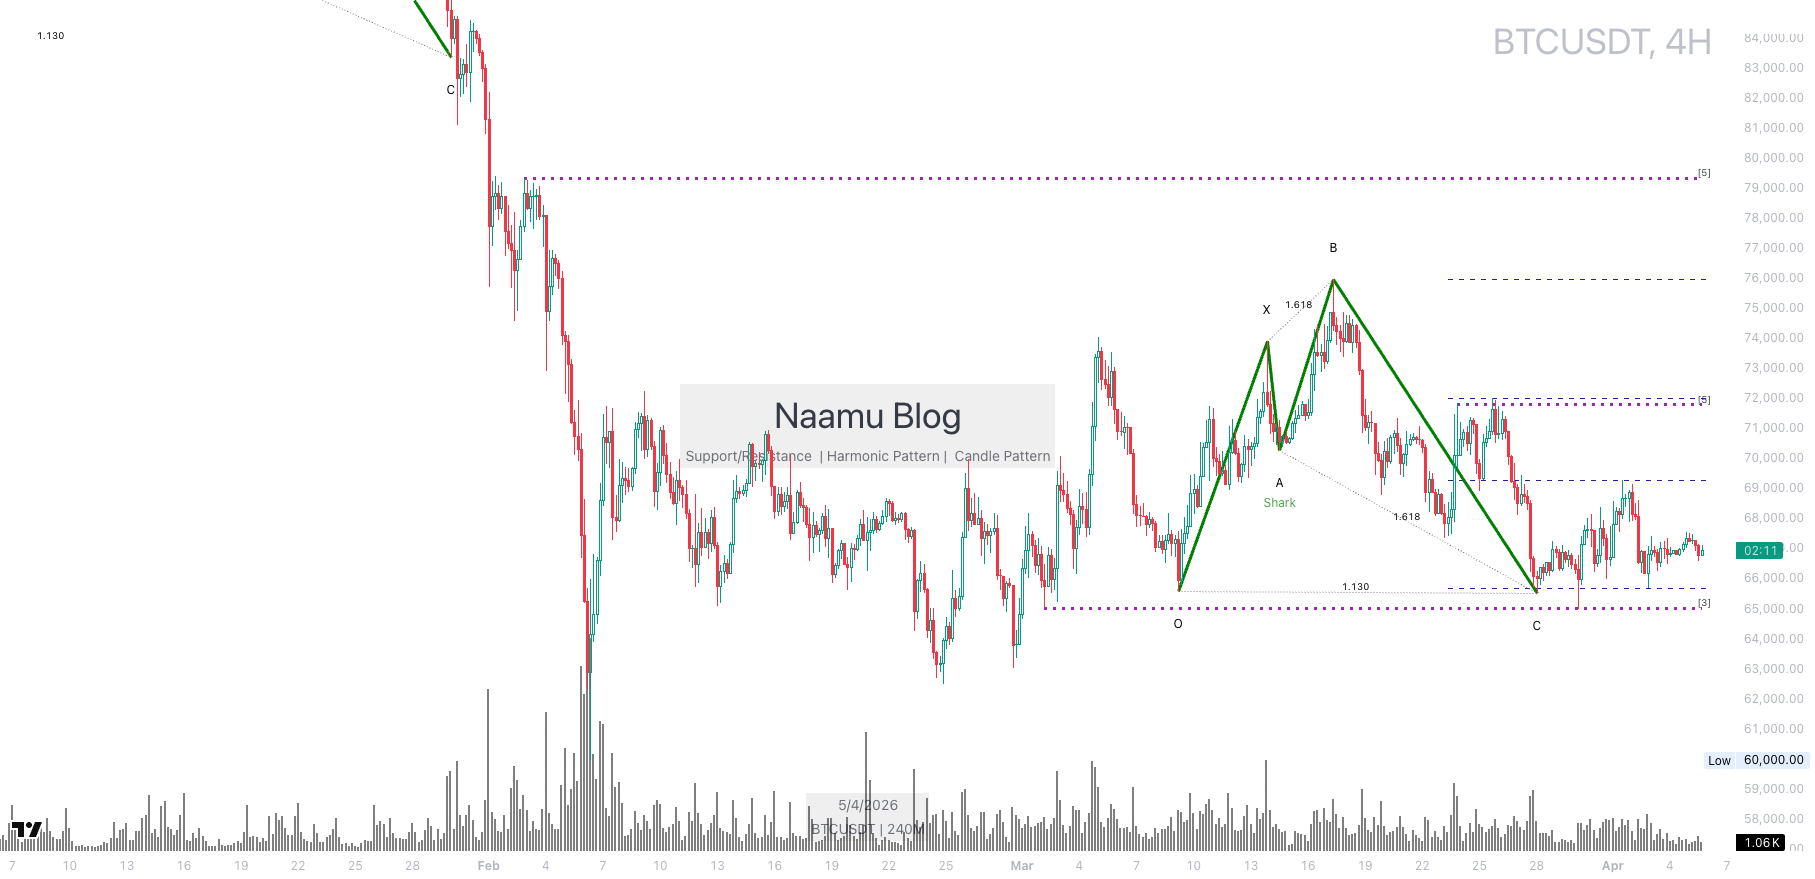 Bitcoin is consolidating near the $69,000 support level, with a Shark harmonic pattern hinting at bullish reversal potential. A break above the $77,000 resistance could act as a short-term upside trigger.
Cross-asset confirmation
DXY Bullish Reversal Pattern, Potential Downward Pressure on Crypto
The DXY (Dollar Index) daily chart has completed an XABCD harmonic pattern, forming a strong bullish reversal structure. This foretells dollar strength, and historically, DXY’s rise—which shows a negative correlation with Bitcoin—could pressure crypto downward.
DXY is consolidating between support levels at 99.500, 96.500, 95.551 and resistance levels at 101.000, 97.500. Pattern completion suggests short-term upward momentum, but the current value is not specified in the provided data, requiring confirmation. ETH is bearish around $2,114, but this analysis focuses on DXY for cross-signal interpretation.
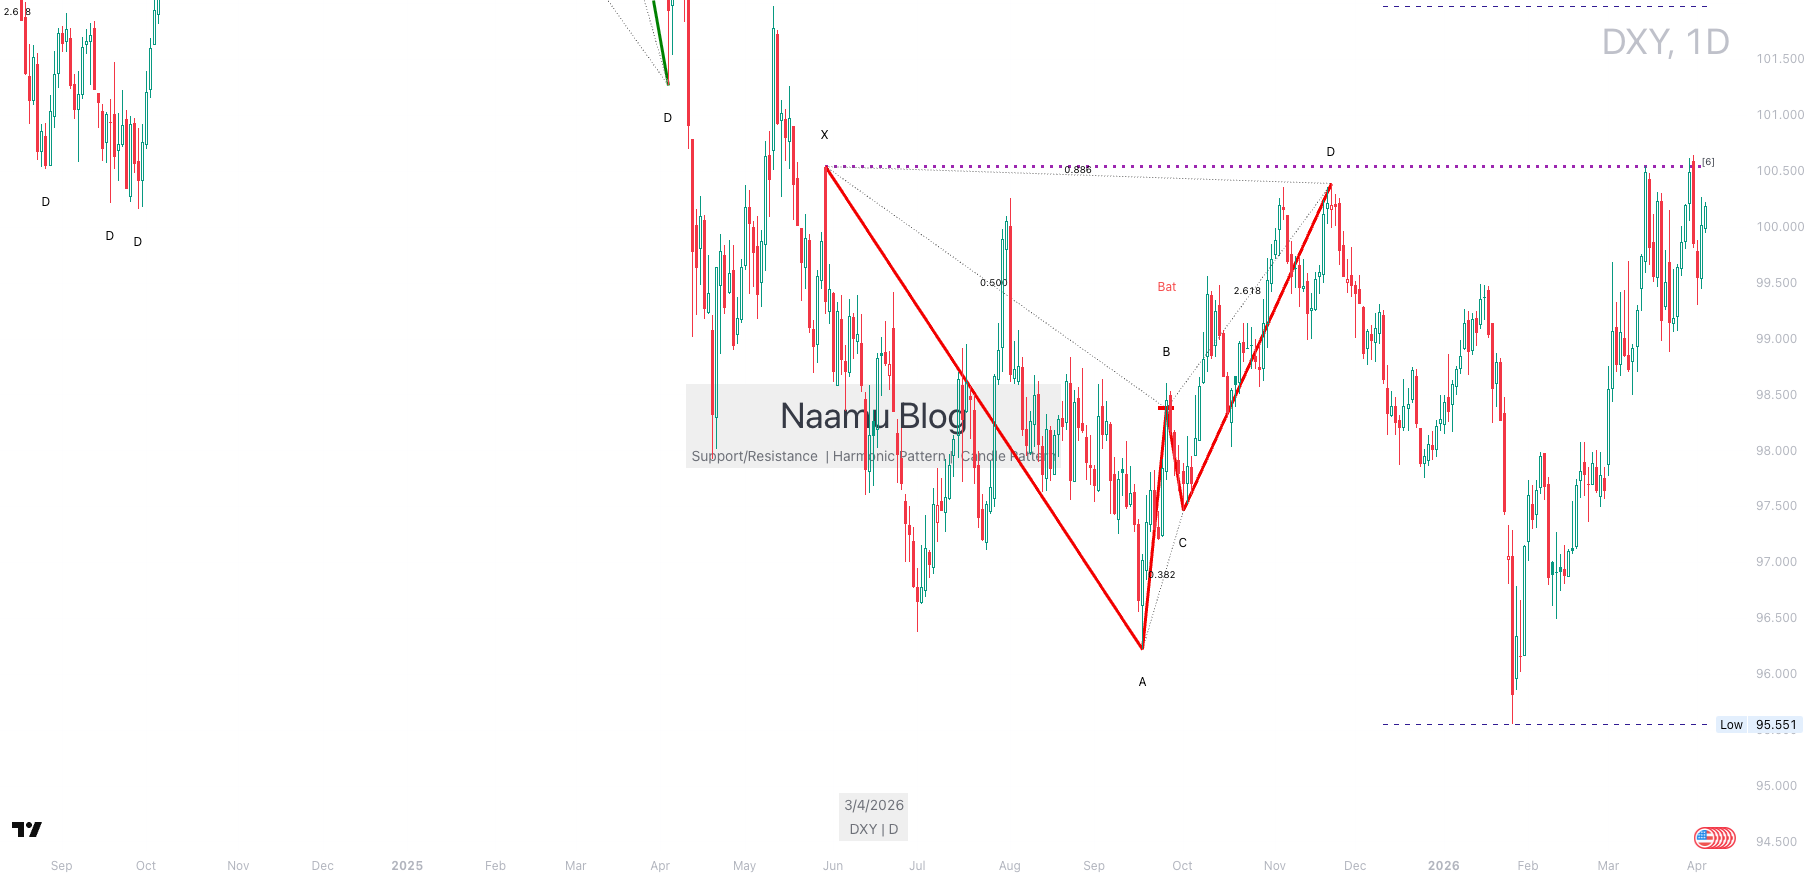 DXY has completed an XABCD harmonic pattern, forming a strong bullish reversal structure. This foretells dollar strength and could pressure crypto downward.
Macro and major headlines
Macro Environment Mixed with Geopolitical Risks and Liquidity Expansion
High-impact events show conflicting macro signals. Iran’s rejection of a US ceasefire proposal (scale 7, bearish) heightens geopolitical uncertainty, potentially negative for risk assets. Conversely, US M2 money supply hitting an all-time high (scale 6, bullish) and JPMorgan’s tokenized asset market growth outlook (scale 5, bullish) suggest liquidity expansion and long-term growth potential.
In major news, China’s rising global approval rating (tg:Fin Watch) and US crude oil price increase of 3% (tg:Fin Watch) indicate global economic realignment and inflationary pressures, but Phantom wallet service outages (theblock, tg:Crypto News) pose limited technical risks. SPX is mentioned as neutral (uncertain), lacking clear direction.
Overall, the macro environment sees coexistence of geopolitical tension and liquidity expansion, expected to have mixed effects on the market.
| Indicator | Current read | Market implication |
|---|---|---|
| BTC Price | $68,937 (-0.4%), sideways within 7-day range $66,794~$69,588 | $69,000 support defense key for short-term stability |
| Fear & Greed Index | 11 (Extreme Fear), momentum +0.0653 | Suggests rebound potential from oversold, momentum shows upward tilt |
| Exchange Net Outflow | -18,057 BTC (7-day), ETF net inflow $4 (7-day) | Eases spot selling pressure, signals accumulation by long-term holders |
Table interprets key indicators as of today (April 7, 2026). Figures are derived from provided market data.
On-chain and derivatives
Net Outflows and Neutral Funding Rates, Derivatives Market Bases for Potential Rebound
On-chain data shows exchange BTC net outflows of -18,057 BTC (7-day), suggesting coins may be moving off exchanges for long-term holding, easing spot selling pressure. ETF net inflows of $4 (7-day) also act as a fund inflow signal, albeit limited.
In derivatives data, BTC funding rate is -0.0003%, near neutral, with a 7-day average of 0.0009%, indicating stability. This means no excessive shorting or long overheat, showing the market is close to balance. The USDTD 4h USDCD chart (stablecoin-related) is slotted but lacks provided analysis results, so the analysis focuses on net outflows and funding rates.
Overall, on-chain and derivatives data suggest the market is setting a potential foundation for a rebound without overheating.
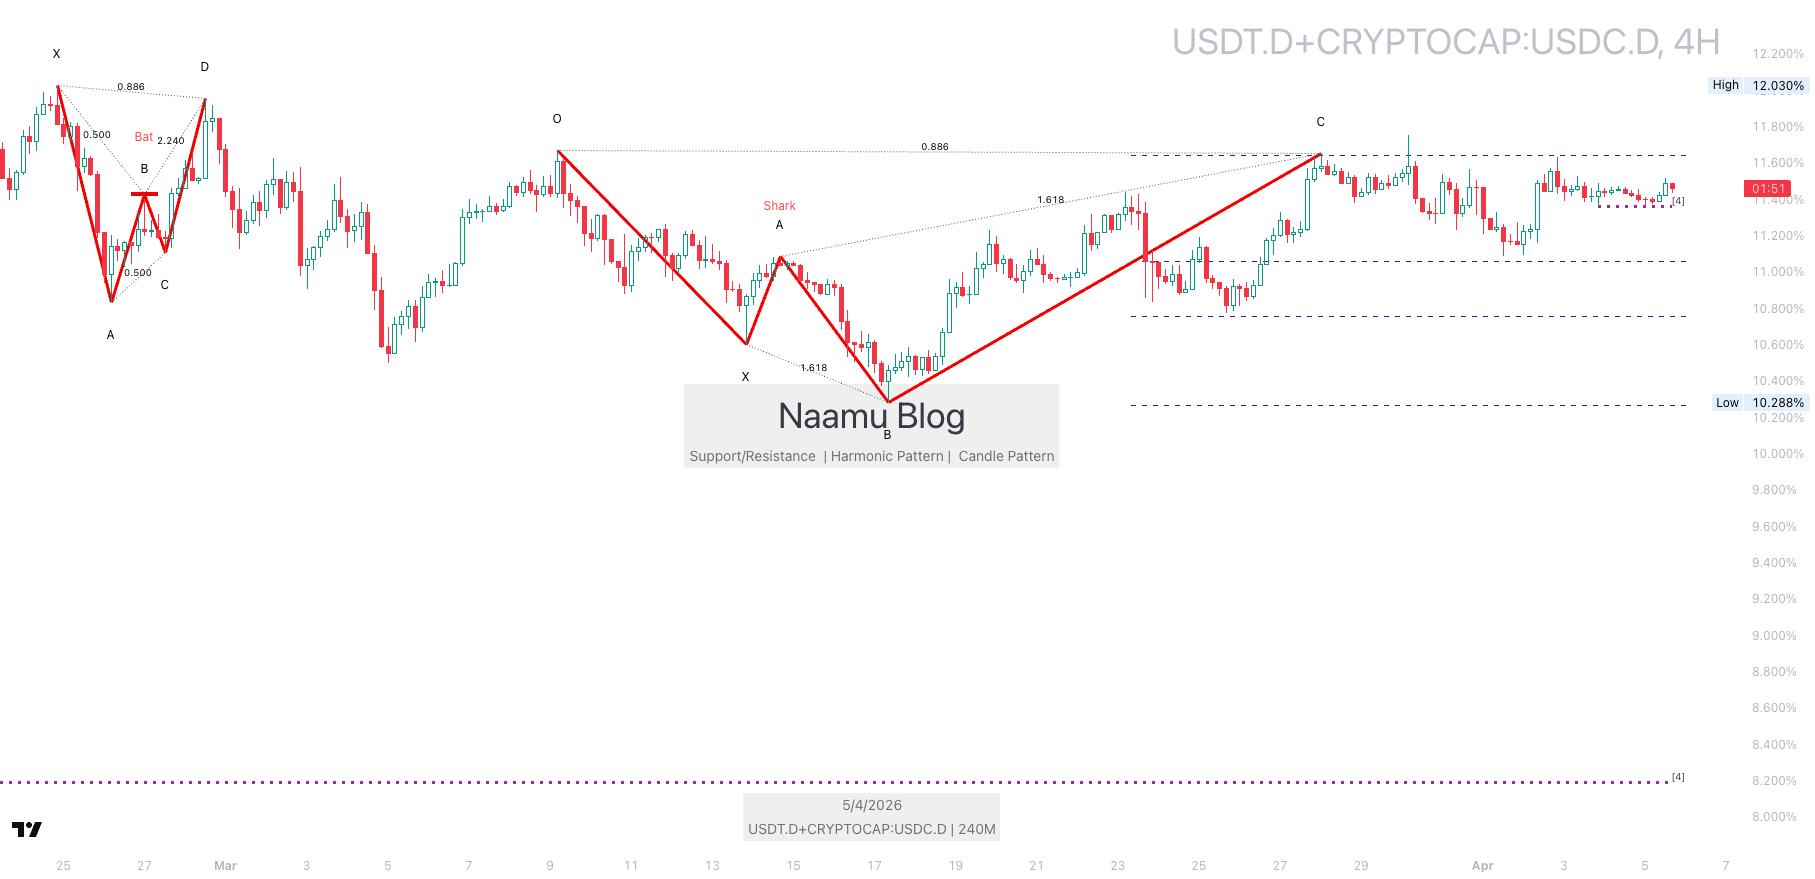 The USDTD 4-hour USDCD chart shows stablecoin liquidity, with the analysis focusing on exchange net outflows and funding rates in the main text.
Near-term scenarios
Base case
If Bitcoin defends the $69,000 support level and continues sideways, with DXY’s bullish reversal pattern having limited impact, exchange net outflows and rising momentum could lead to a rebound testing the $73,000~$77,000 range.
Alternative case
If DXY’s strong bullish reversal accelerates dollar strength, pressuring Bitcoin downward, a retest of the $66,000 or $64,000 support levels becomes more likely.
Checklist
- Monitor BTC’s defense of the $69,000 support level.
- Watch if DXY breaks above the 101.000 resistance level.
- Check if exchange net outflow trends persist.
- Observe changes in the Fear & Greed Index and momentum.
Related reads
How to read DXY-Bitcoin correlation A guide to reading BTC funding rates Reading the market with on-chain data
FAQ
What is the impact of DXY’s bullish reversal pattern on Bitcoin?
DXY’s completed XABCD harmonic pattern suggests dollar strength, which could pressure Bitcoin downward. However, current exchange net outflows and ETF inflows act as offsetting factors, likely resulting in mixed effects.
Is the Fear & Greed Index at 11 (Extreme Fear) a buying opportunity?
Extreme Fear indicates oversold conditions and suggests rebound potential, but it should not be interpreted as a buy signal alone. Additional confirmation, such as rising momentum and technical support defense, is needed.
Why are exchange net outflows important?
Exchange net outflows mean coins are leaving exchanges, potentially for long-term holding (hodling), which eases spot selling pressure and can act as a positive signal for the market.
Related Posts
Newsletter
Weekly Quant & Market Insights
Get market analysis, quant strategy ideas, and AI & data tool insights delivered to your inbox.
Subscribe →