Bitcoin Holds 69K Range as DXY Weakness Tests a Rebound Setup
Dollar weakness, exchange outflows, and fresh capital inflow signals supported a rebound attempt. But with BTC still trapped near 69K, fear sentiment and OTC pressure remained the key downside checks.
Why this matters today
DXY downtrend creates a dollar-weak environment favorable for Bitcoin
Exchange net outflows and rising momentum suggest short-term rebound potential
Large capital inflow event ($150B added) positively impacts the market
Bitcoin: reading the main chart
BTC’s Defense of 64K-65K Support Key to Short-Term Rebound
Analysis of the BTC/USDT 4-hour chart shows price currently around $68,937, consolidating within the recent 7-day range ($66,794 – $69,588). Technically, a green Shark harmonic pattern is observed, suggesting a bullish reversal possibility with its XABCD structure.
Key support levels are at $64,000-$65,000 and $62,000; holding these could set the stage for an upward move. Resistance lies at $78,000-$80,000, a break above which may shift to a longer-term uptrend. Price is moving near support, with direction unclear until pattern completion.
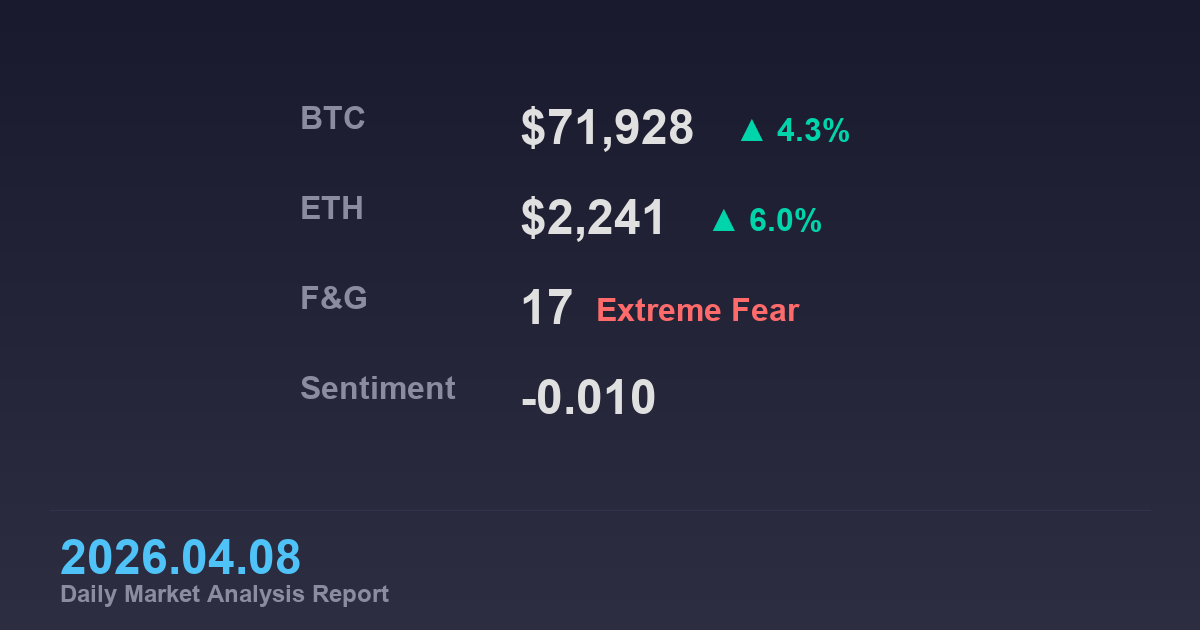
Market sentiment reflects downside pressure with a Fear & Greed Index of 11 (Extreme Fear), but momentum indicator (+0.0653) tilts toward a rebound, supporting short-term upside potential.
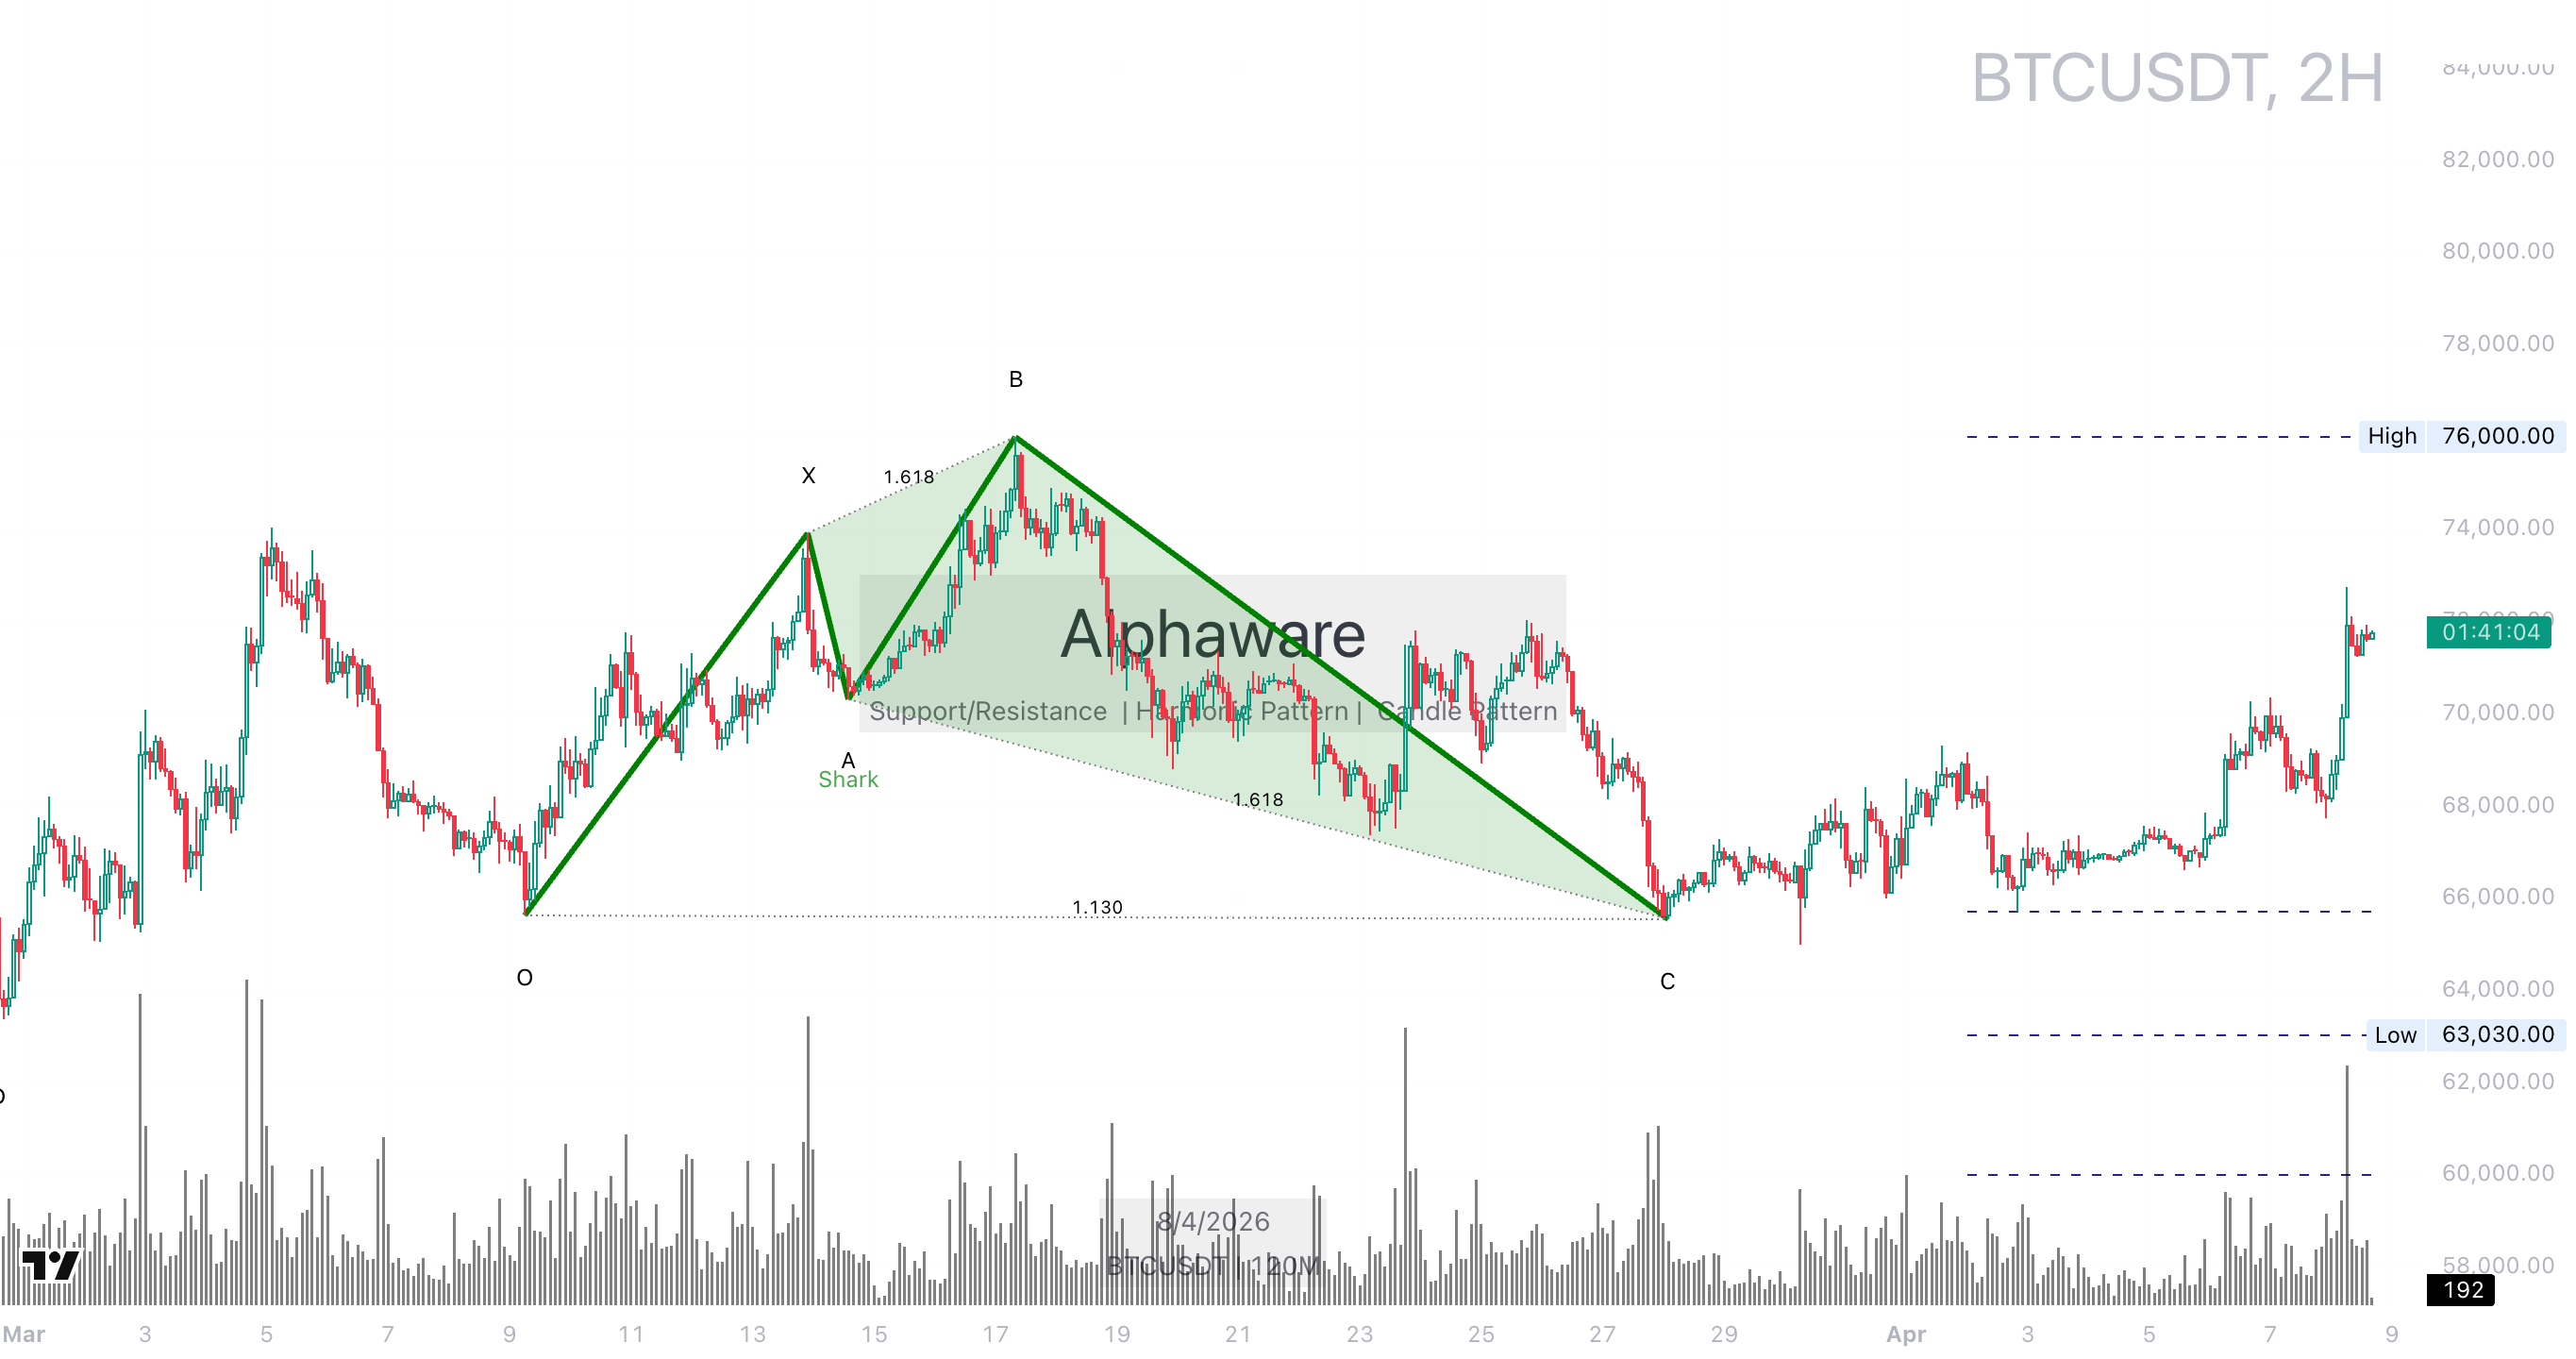 BTC is consolidating between support at 64K-65K and resistance at 78K-80K, with the Shark pattern suggesting a bullish reversal possibility.
Cross-asset confirmation
DXY Downtrend Sends Positive Signal for Bitcoin
Analysis of the DXY 1-day chart shows the dollar index in a clear downtrend, generally favorable for risk assets like Bitcoin. Key support is at 99.000, with resistance at 100.000 and 1.0618.
A Deep Crab harmonic pattern is noted, indicating potential for a strong bullish reversal from point A to C or D, but the current trend remains downward. Continued DXY weakness could act as upward pressure for Bitcoin, interpreted as a bullish signal in cross-asset analysis.
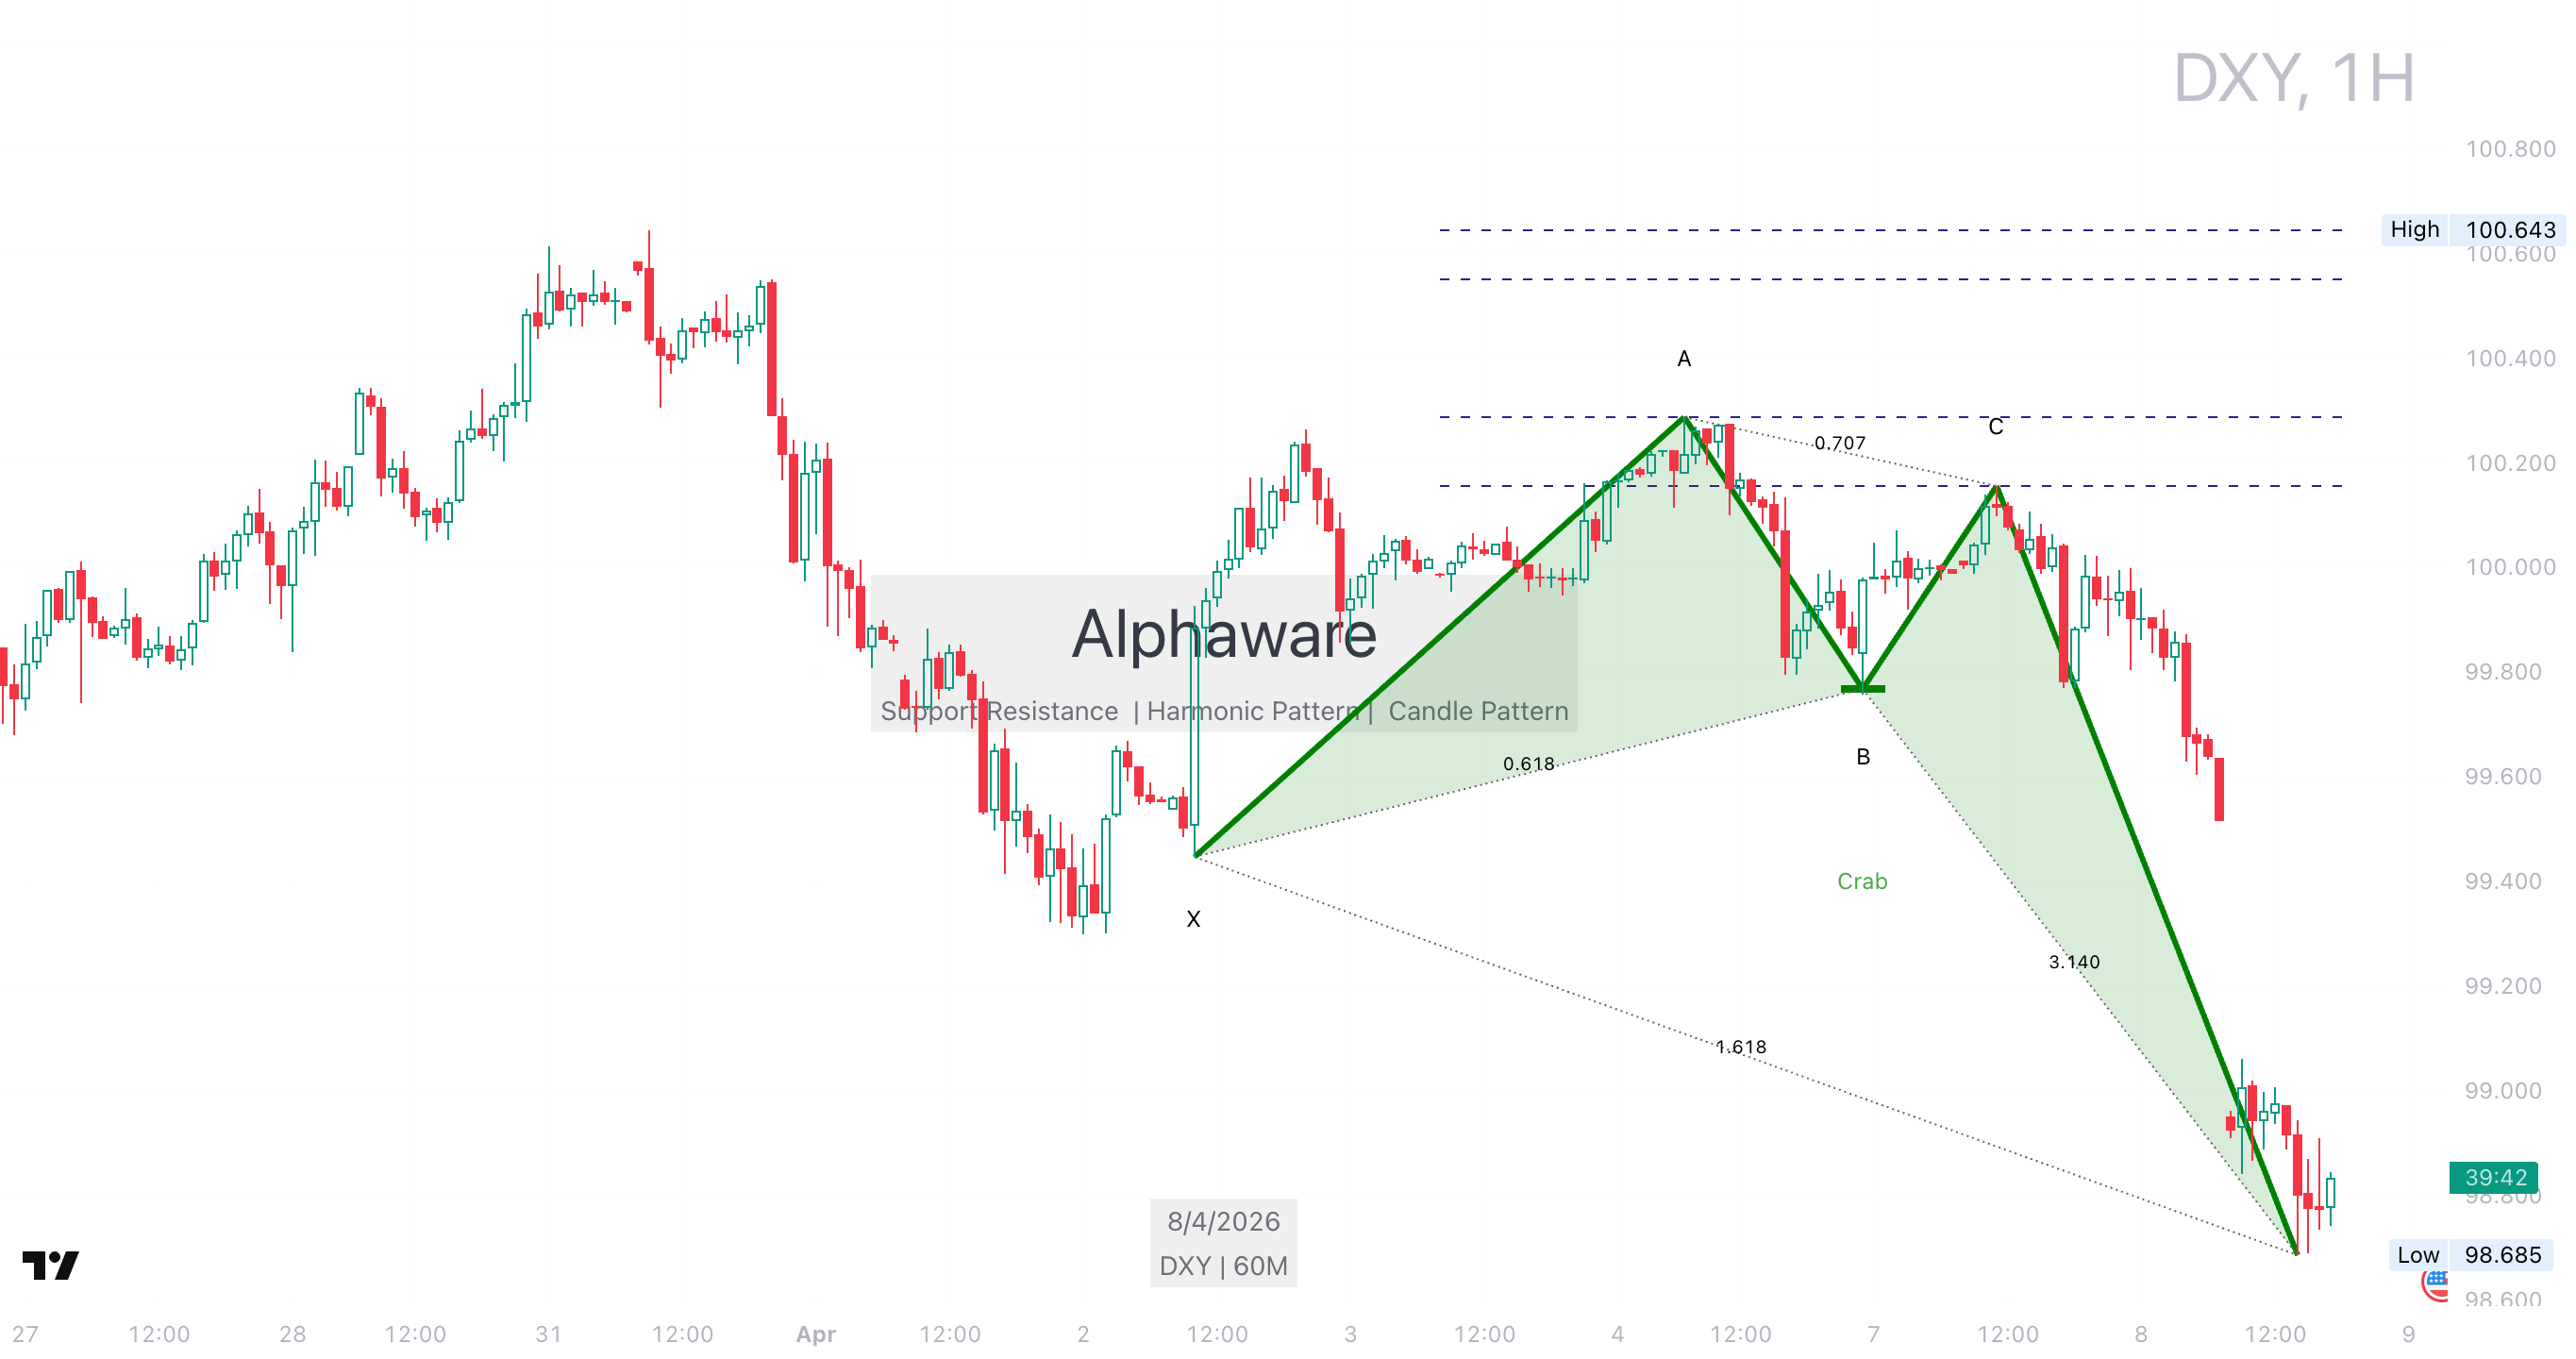 DXY is in a downtrend, offering a favorable macro backdrop for Bitcoin, with the Deep Crab pattern hinting at a bullish reversal potential.
Macro and major headlines
Mixed Impact from Macro Events and News
Recent high-impact events include “$150,000,000,000 has been added to the crypto market in the past 24 hours.” (scale 7, bullish, macro_geopolitical), suggesting large capital inflows. Concurrently, “현재 OTC 거래가 활황이랍니다. - 평균 할인율은 40~50%” (scale 6, bearish, whale_onchain) indicates potential bulk selling pressure.
News-wise, [tg:Fin Watch] “BREAKING: 🇺🇸 US crude oil prices rise by 3%, up to over $115.” may raise inflation concerns but has limited direct crypto impact. [theblock] “Phantom reports ongoing service outage affecting in-app balances” focuses on user inconvenience rather than broad market effects.
Overall macro sentiment is negative at -0.108, but DXY decline and inflow events could offset this.
| Indicator | Current read | Market implication |
|---|---|---|
| BTC Price | $68,937 (-0.4%), 7-day range $66,794 – $69,588 | Testing support within consolidation range |
| Fear & Greed Index | 11 (Extreme Fear) | Psychological downside pressure present |
| Exchange Net Outflow | -18,057 BTC (7-day) | Sign of easing spot selling pressure |
Table data is based on real-time values as of April 8, 2026, reflecting mixed market signals.
On-chain and derivatives
Conflicting Signals from On-Chain and Derivatives Data
On-chain, exchange BTC net outflow is -18,057 BTC (7-day), indicating reduced spot selling pressure—a bullish signal. Meanwhile, BTC funding rate is -0.0003%, neutral and similar to the 7-day average of 0.0009%, suggesting limited aggressive shorting in derivatives.
High-impact events like “Stablecoin supply on Ethereum has hit an ATH of $180B” (scale 5, bullish, whale_onchain) point to liquidity growth, but OTC discounts of 40-50% warn of potential bulk sales. The USDTD 4h USDCD chart serves as auxiliary, useful for monitoring stablecoin liquidity shifts.
Overall, on-chain data is buffering, while derivatives are neutral, showing the market is seeking direction.
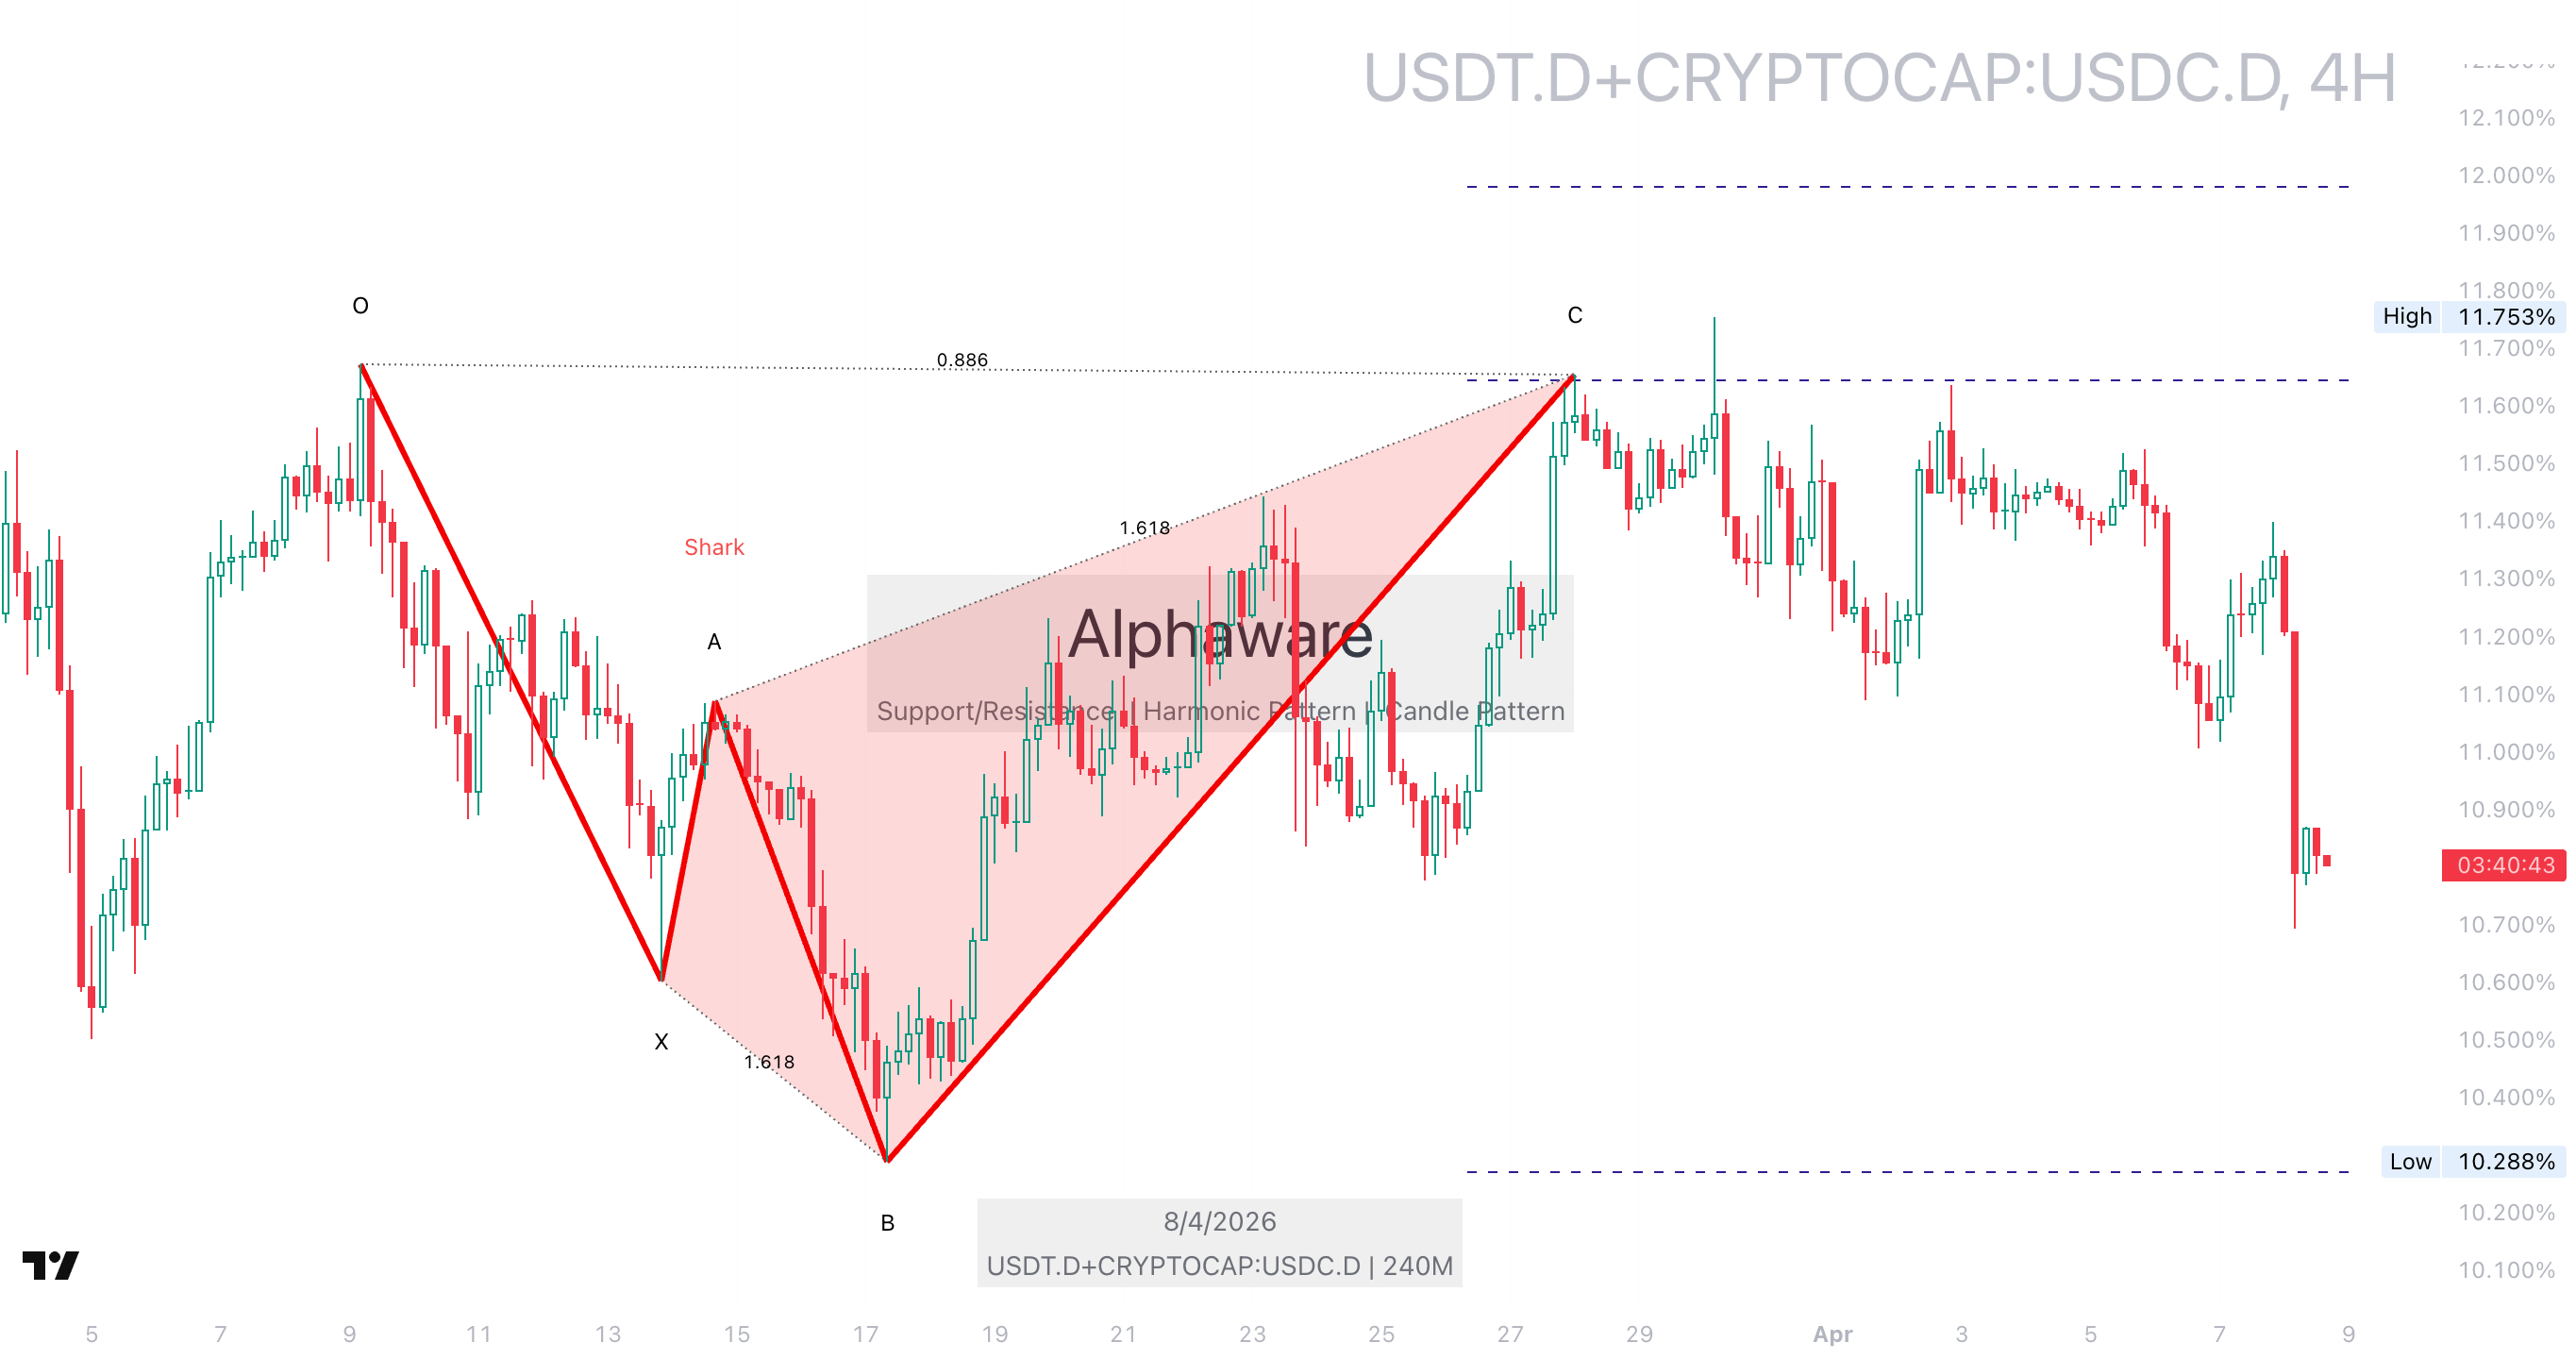 The USDTD chart aids in monitoring stablecoin liquidity, combined with on-chain data to analyze market flow.
Near-term scenarios
Base case
If Bitcoin defends the 64,000-65,000 support level, DXY downtrend persists, and exchange net outflows combine with rising momentum, a short-term rebound could test the 73,000-77,000 range.
Alternative case
If extreme fear and OTC discounts intensify, breaking the 64,000-65,000 support and DXY reverses upward, further downside to the 62,000 level is possible.
Checklist
- Monitor BTC’s defense of 64,000-65,000 support
- Track if DXY trend remains downward
- Check persistence of exchange net outflows
- Follow changes in Fear & Greed Index
Related reads
2026년 04월 07일 암호화폐 시장 분석 2026년 04월 06일 암호화폐 시장 분석 2026년 04월 05일 암호화폐 시장 분석
FAQ
Why is DXY decline positive for Bitcoin?
A decline in DXY (Dollar Index) indicates dollar weakness, which can promote capital flow into risk assets like Bitcoin, generally interpreted as a positive signal.
What impact does Fear & Greed Index 11 (Extreme Fear) have?
Extreme Fear shows market participants are fearful, potentially acting as short-term downside pressure, but historically it can also mark rebound points, requiring careful observation.
Why are exchange net outflows a bullish signal?
Exchange net outflows mean Bitcoin is moving off exchanges into long-term storage, reducing spot selling pressure and creating favorable conditions for price appreciation.
Related Posts
Newsletter
Weekly Quant & Market Insights
Get market analysis, quant strategy ideas, and AI & data tool insights delivered to your inbox.
Subscribe →