GDP and PCE Day: Bitcoin at 71.8K Faces Macro and On-Chain Conflict
With US GDP and Core PCE released on the same day, macro pressure took center stage. Bitcoin traded near 71.8K as on-chain support clashed with dollar strength and still-fragile sentiment.
Why this matters today
Inflation indicator Core PCE directly affects Fed rate policy expectations, influencing dollar (DXY) and risk asset flows.
Bitcoin’s technical chart shows mixed conditions with a bullish pattern and downtrend lacking clear direction.
On-chain data is positive, but macro variables and market sentiment conflict, potentially increasing short-term volatility.
Bitcoin: reading the main chart
Bitcoin at 71.8K: Shark Pattern Clashes with Downtrend
Bitcoin is currently at $71,837, near the top of its 7-day range ($66,877~$72,111). The 4-hour chart analysis shows a Shark harmonic pattern (suggesting a bullish reversal), indicating potential bounce from support levels at $68,000 and $66,000.
However, the chart also exhibits an overall downtrend, creating a mixed technical picture where pattern signals conflict with trend direction. Key resistance levels are at $74,000 and $76,000.
This conflict means today’s economic data releases could act as a catalyst to confirm or negate the technical signals. Note for beginners: Harmonic patterns are technical analysis tools that use Fibonacci ratios to predict reversal points.
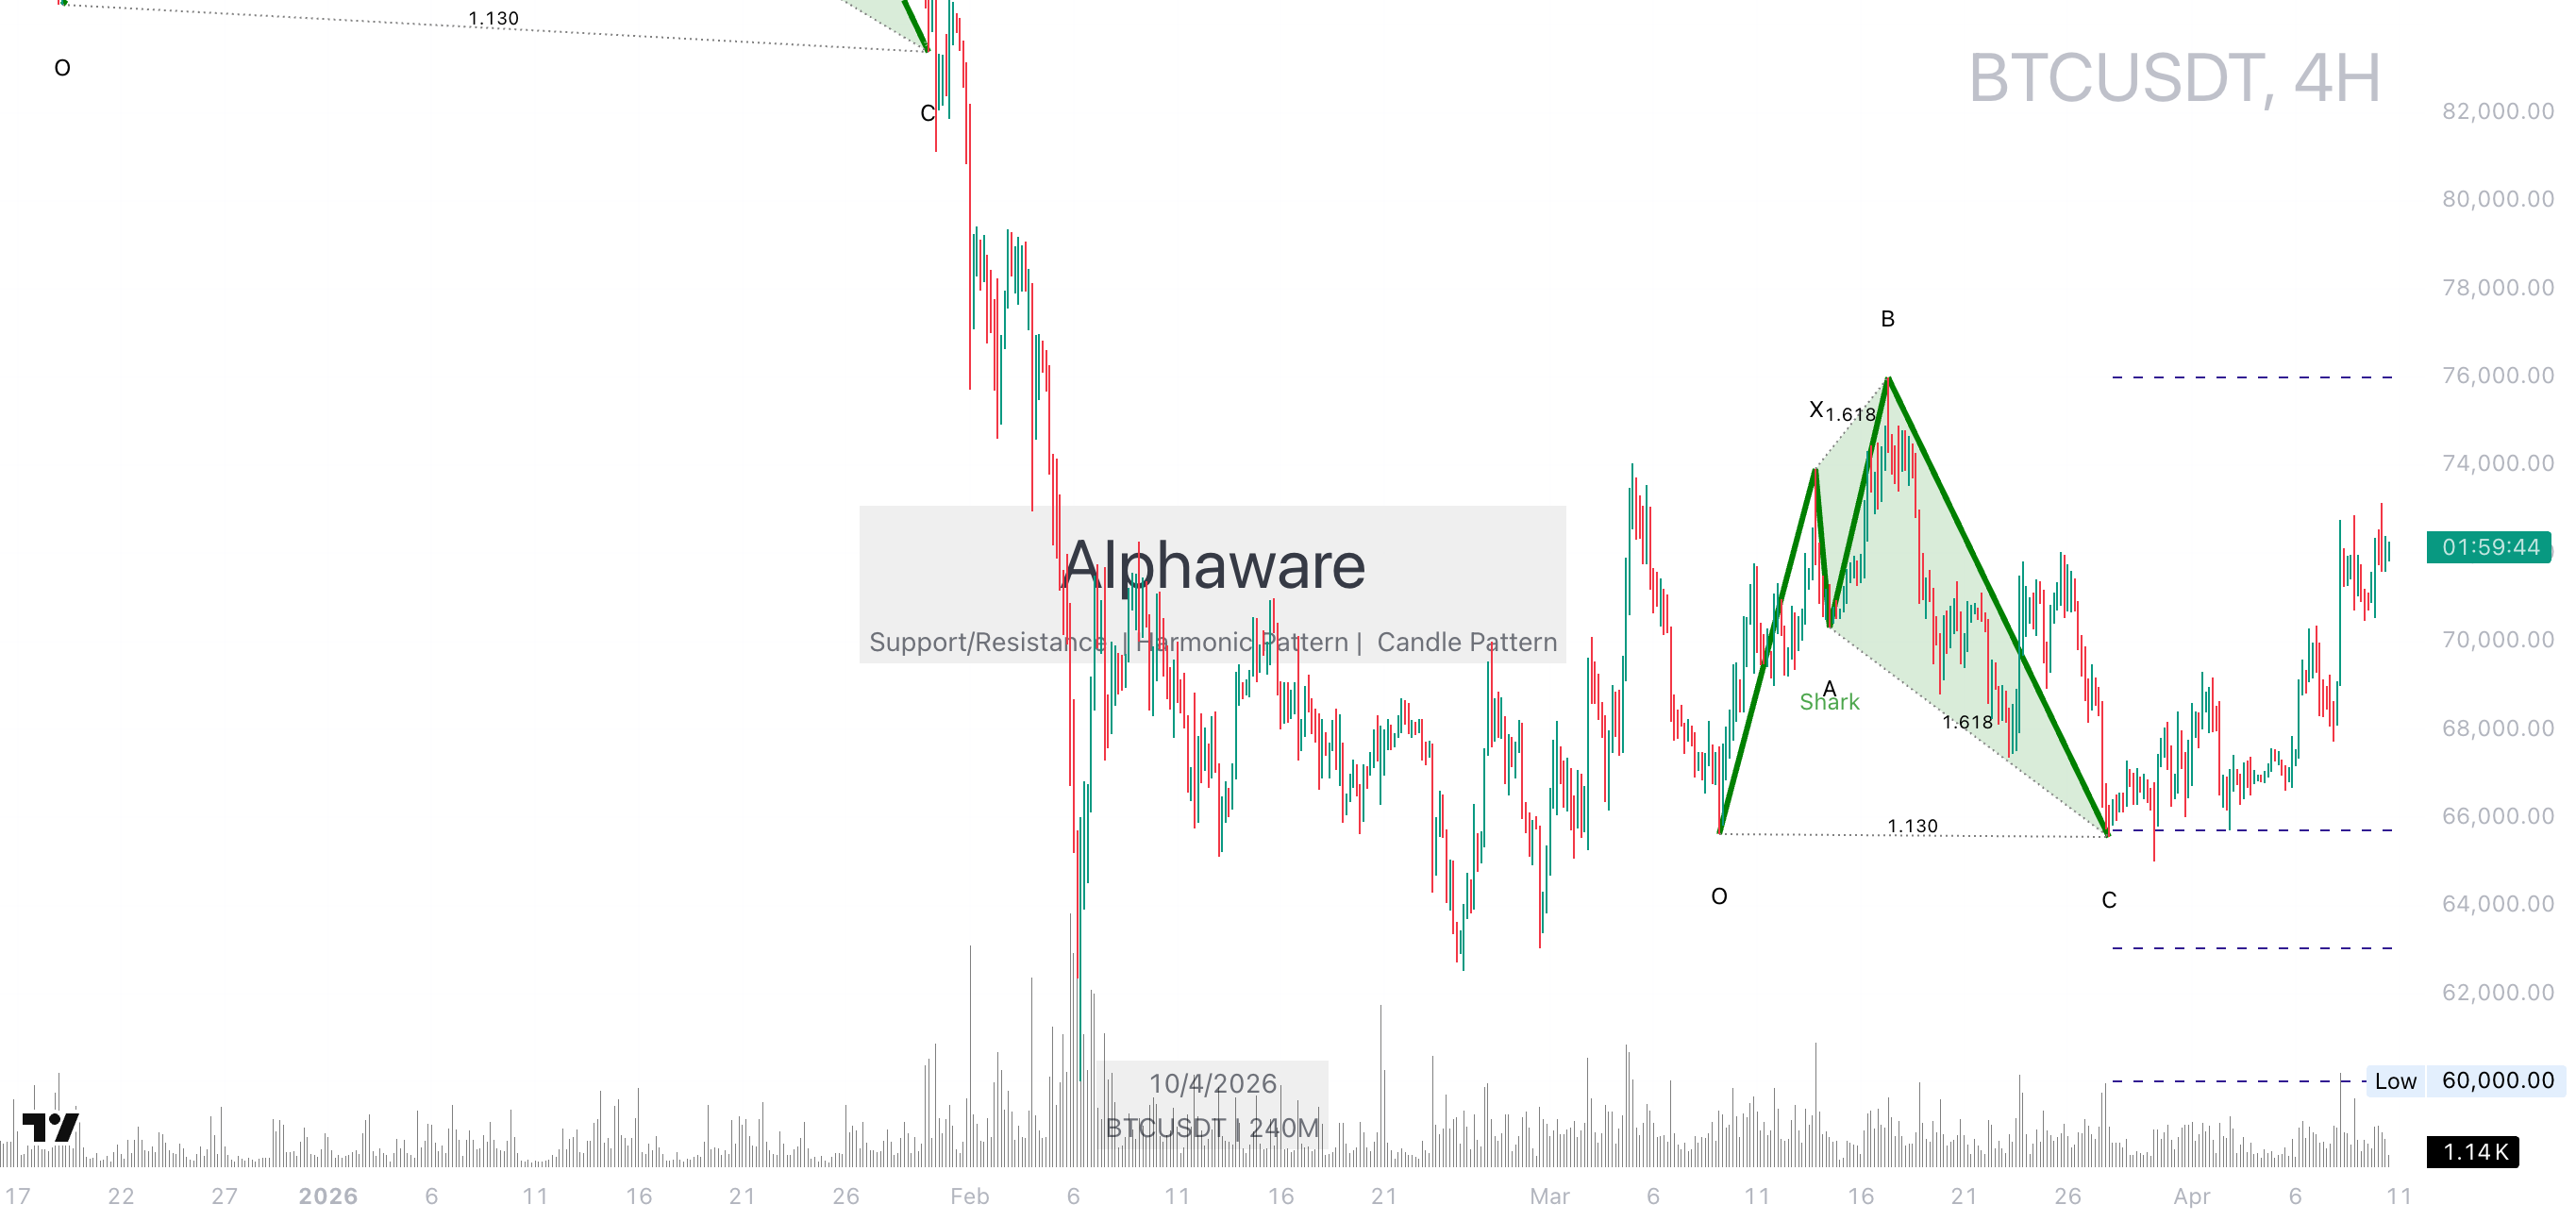 BTC 4-hour chart: Shark bullish reversal pattern (green) forms near $68K~$66K support, but conflicts with overall downtrend (red arrow), showing mixed signals.
Cross-asset confirmation
DXY Strength Poses Headwind for Bitcoin
The DXY daily chart shows a Crab harmonic pattern (suggesting bullish reversal potential) forming within a downtrend, with key resistance at 100.643.
If DXY reverses upward, dollar strength typically acts as downside pressure on risk assets like Bitcoin, a risk that could be triggered if today’s Core PCE release shows strong inflation.
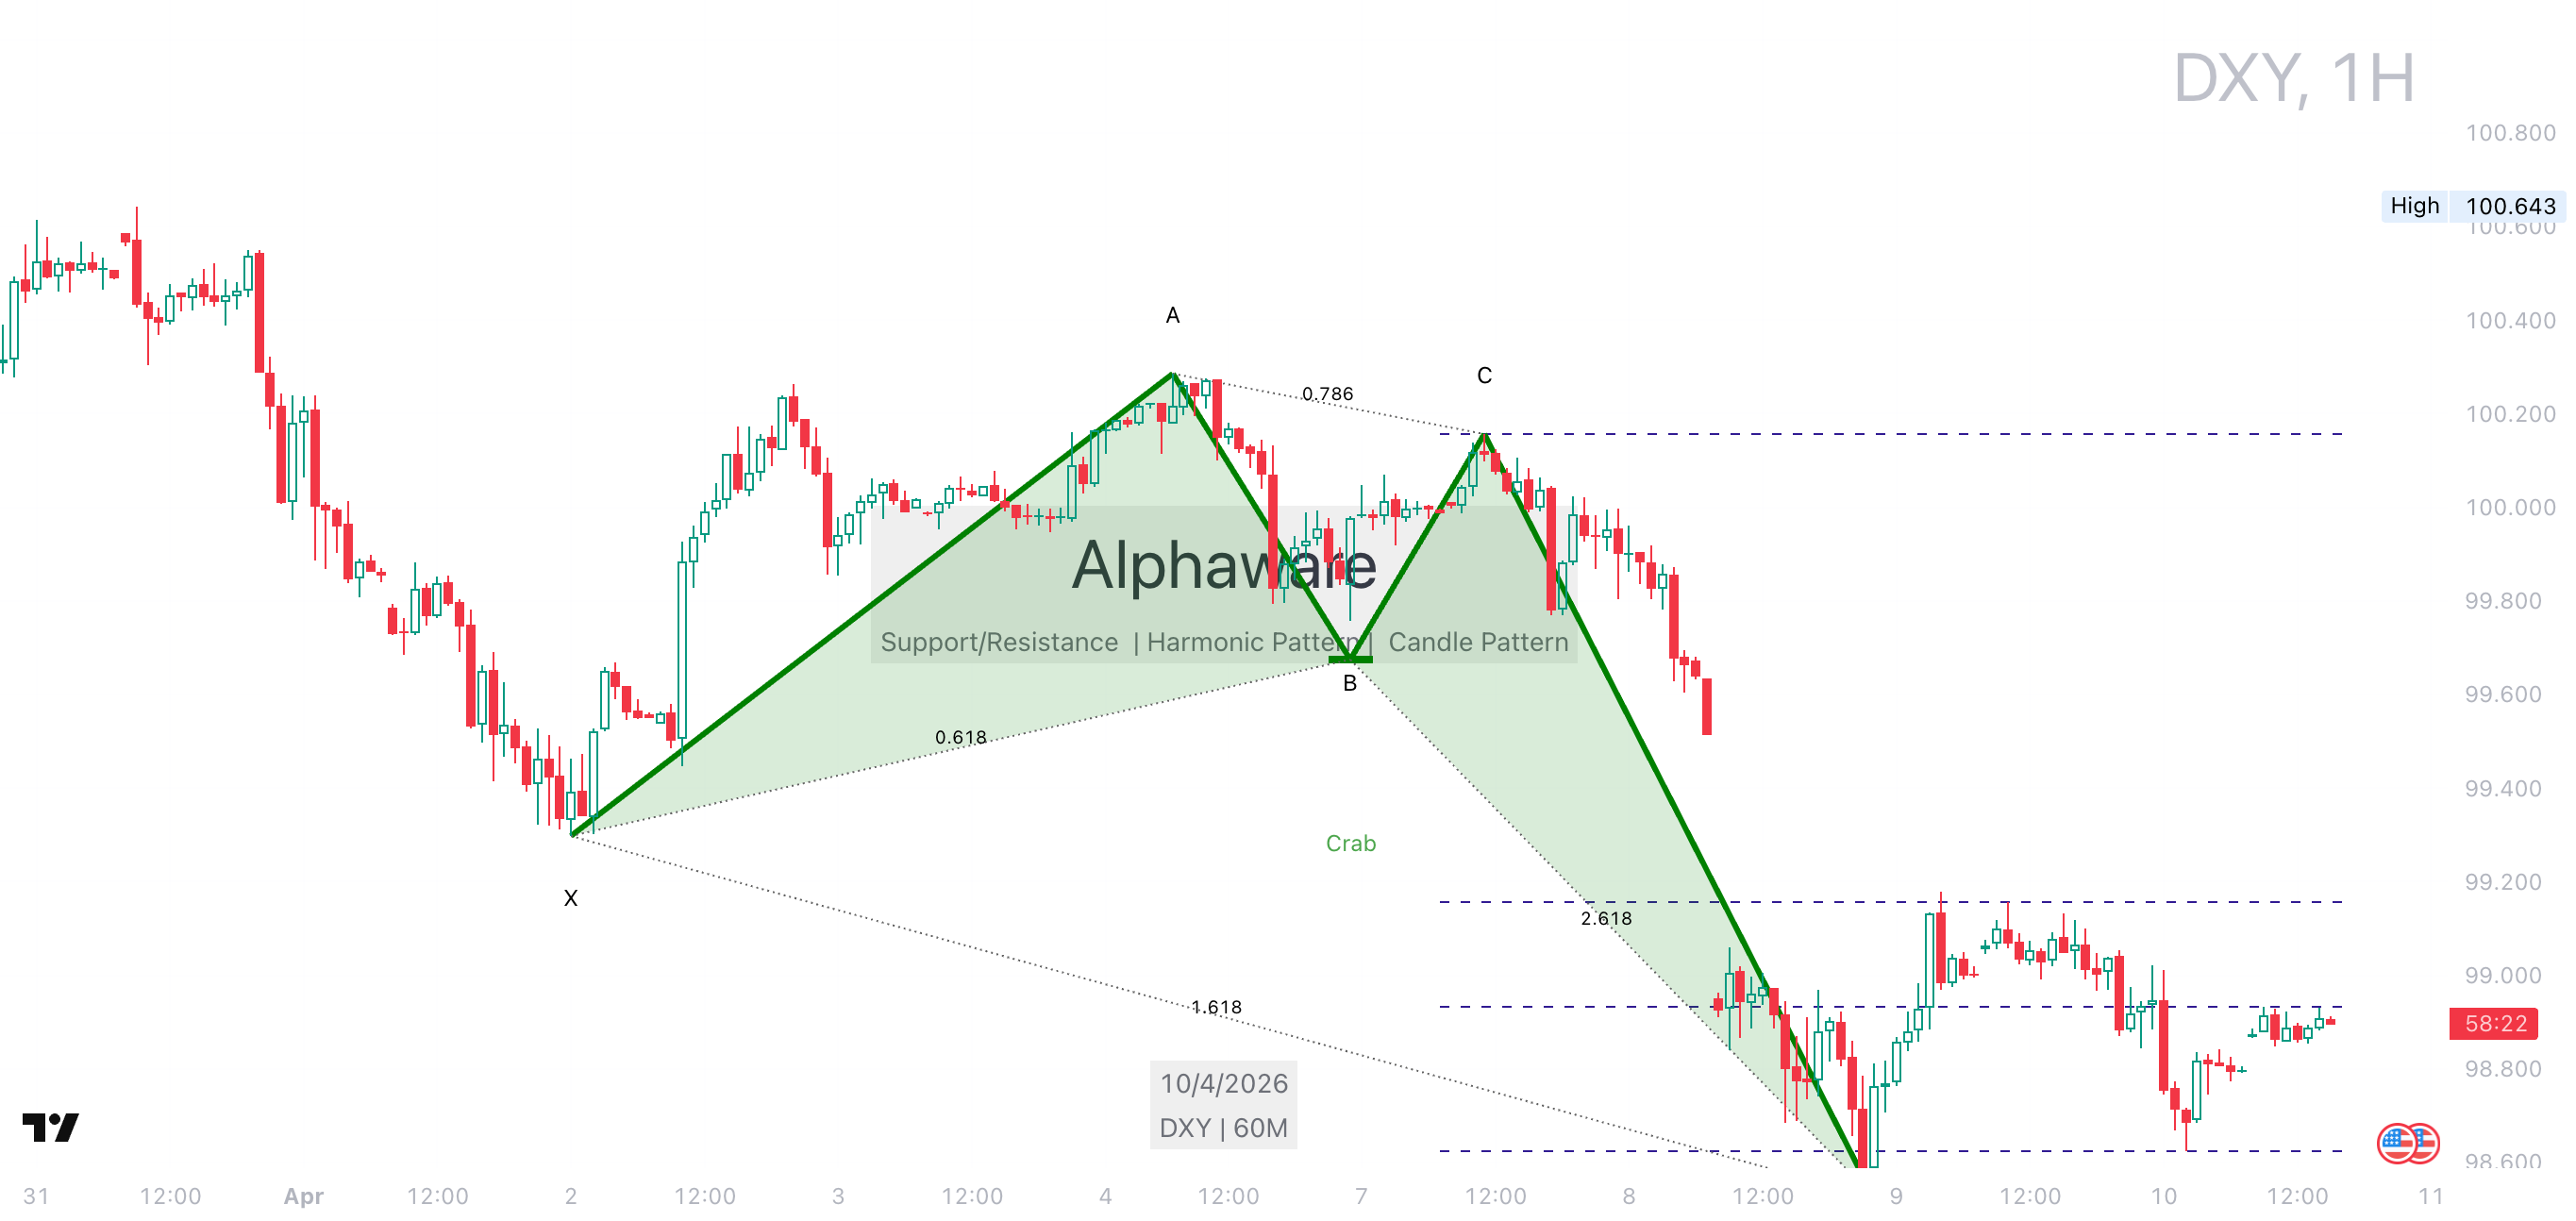 DXY daily chart: Crab harmonic pattern within downtrend suggests bullish reversal potential, with 100.643 as key resistance.
Macro and major headlines
GDP and PCE Releases to Determine Market Direction
Today’s US Final GDP quarterly growth (forecast 0.7%, previous 0.7%) and Core PCE monthly change (forecast 0.4%, previous 0.4%) are key market variables. PCE is the Fed’s preferred inflation gauge; exceeding forecasts could boost dollar strength and rate hike expectations, negatively impacting Bitcoin.
Conversely, data below or in line with forecasts could support Bitcoin upside momentum via dollar weakness and eased liquidity concerns. Source: Forex Factory economic calendar.
Meanwhile, regulatory positives like Japan’s crypto legal asset recognition (scale 6 bullish event) and US CLARITY Act implementation readiness (scale 8 bullish event) are medium-term supportive but may have limited short-term impact ahead of high-impact data.
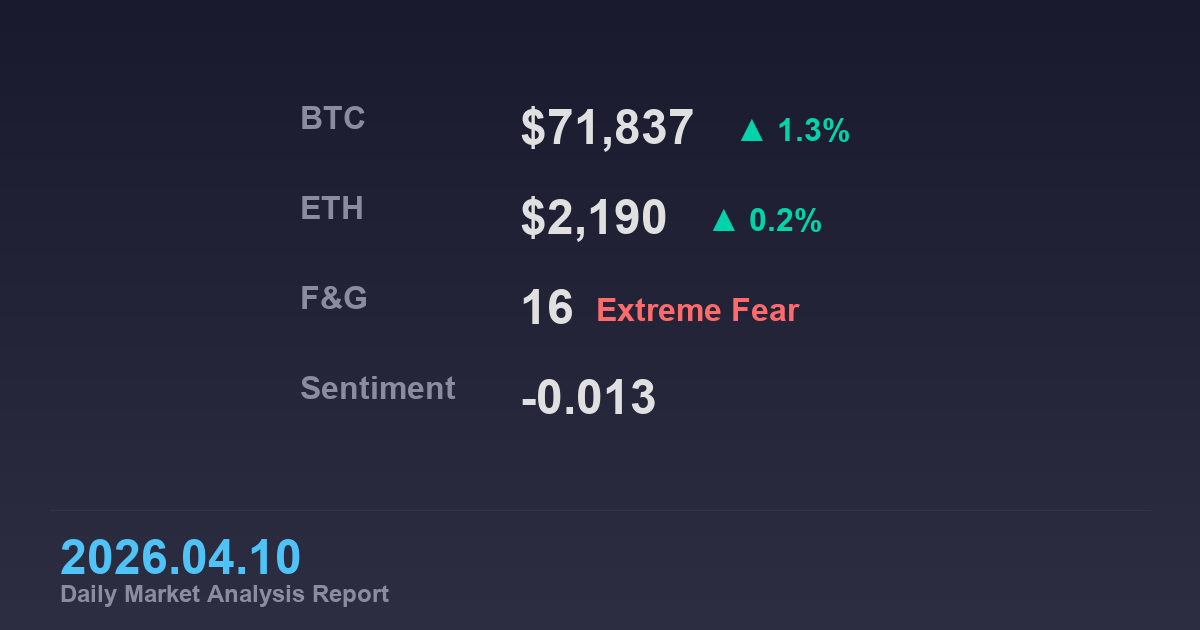
| Indicator | Current read | Market implication |
|---|---|---|
| BTC Price | $71,837 (+1.3%), within 7-day range $66,877~$72,111 top | Potential test of short-term resistance ($74K~$76K), volatility expansion |
| Fear & Greed Index | 16 (Extreme Fear) | Bearish market sentiment, could also signal bounce opportunity |
| Funding Rate | BTC 0.0004%, ETH 0.0000% (neutral levels) | Low overheating or short squeeze pressure in derivatives |
Table data reflects real-time values or recent cumulative figures as of April 10, 2026.
On-chain and derivatives
Net Outflows and ETF Inflows Positive, Volatility Caution Needed
On-chain data shows exchange BTC net outflows (-18,057 BTC, 7-day), suggesting reduced spot selling pressure, while BTC ETF net inflows ($166) are positive for capital flow.
Funding rates (BTC 0.0004%) are at neutral levels, indicating no significant overheating or short squeeze pressure in derivatives. Note for beginners: Funding rates are periodic payments between long/short positions in futures markets; high rates suggest long overheating, low rates indicate neutrality.
However, market sentiment (overall -0.013) and momentum (+0.0066) are weak, meaning on-chain positives may not immediately translate to price gains due to macro variables and psychological resistance.
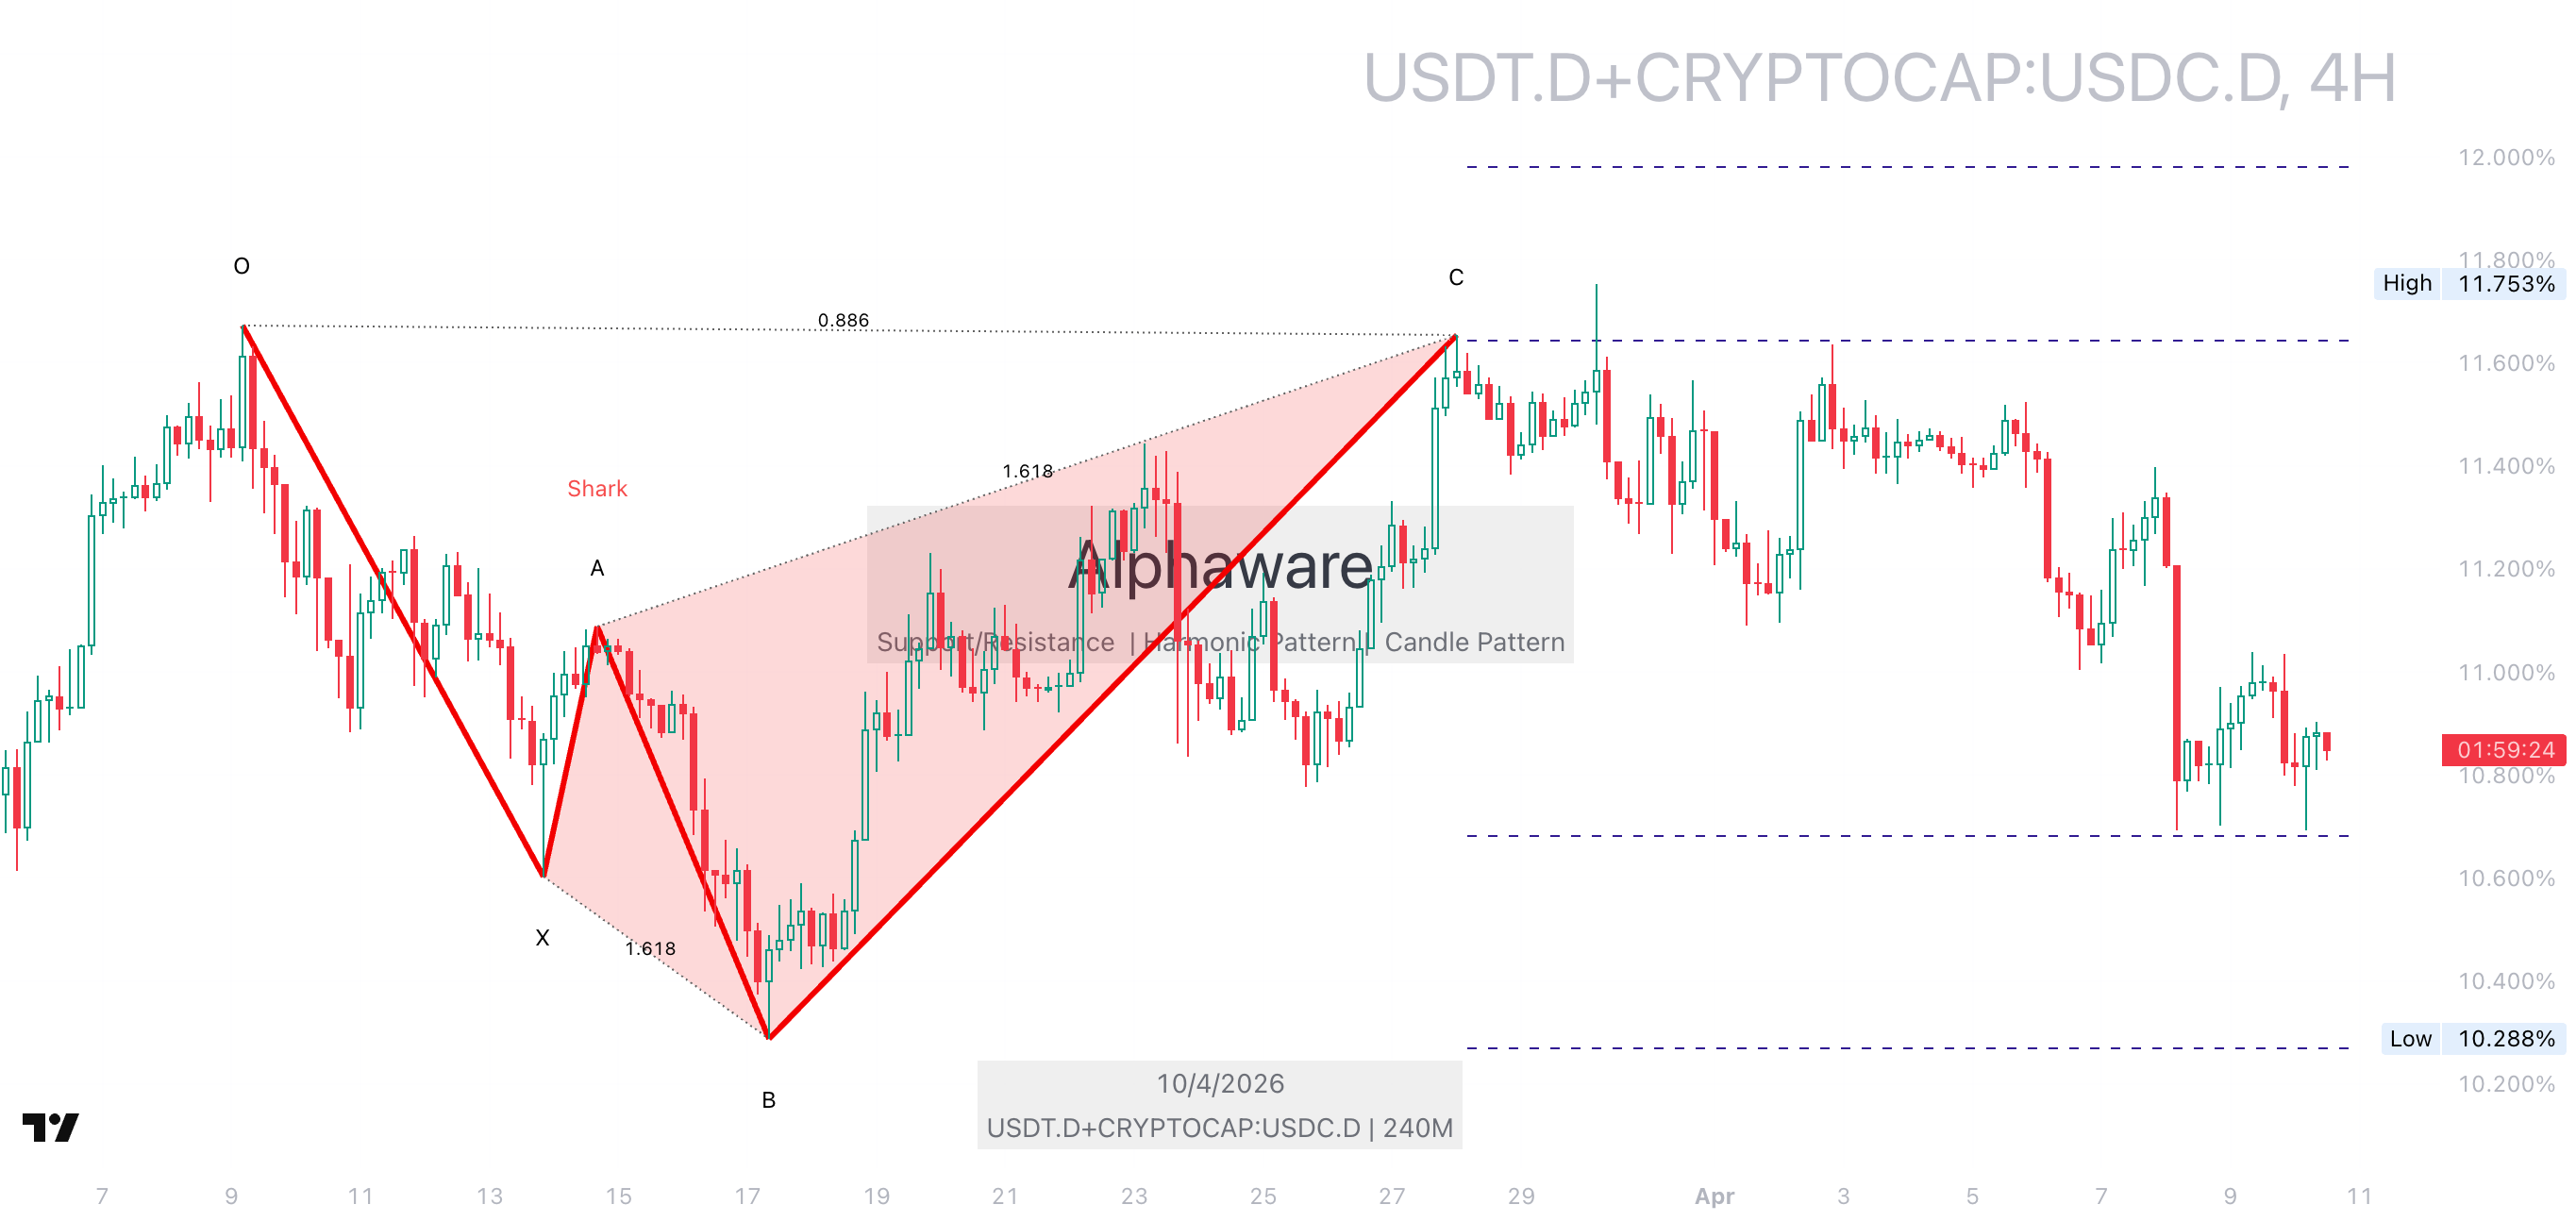 USDTD 4-hour USDCD chart: Stablecoin liquidity fluctuations as supplementary data, with on-chain net outflows and ETF inflows as key points.
Near-term scenarios
Base case
If GDP and PCE data come in as expected, leading to a neutral market reaction, Bitcoin will likely maintain mixed signals and range-bound movement between $68,000 and $74,000. Continued exchange outflows and ETF inflows could limit downside, but DXY strength and extreme fear may cap upside.
Alternative case
If PCE data exceeds forecasts, raising strong inflation concerns, dollar strength (DXY rise) and rate hike expectations could pull Bitcoin toward support below $68,000. Conversely, weaker data could activate the Shark pattern, leading to a test of the $74,000 resistance.
Checklist
- Monitor US Core PCE release result (forecast 0.4%)
- Observe if DXY breaks above 100.643 resistance
- Check BTC defense at $68,000 support
- Track exchange net outflow trends
Related reads
2026년 04월 08일 암호화폐 시장 분석 2026년 04월 07일 암호화폐 시장 분석 2026년 04월 06일 암호화폐 시장 분석
FAQ
Why is the Shark pattern important?
The Shark pattern is a harmonic pattern that suggests potential reversal at specific Fibonacci ratios. Currently observed on the BTC chart, it indicates bullish reversal potential around $68,000~$66,000, but since it conflicts with the downtrend, it should be confirmed with other indicators rather than used alone for conclusions.
Is Fear & Greed Index at 16 (Extreme Fear) a buying opportunity?
Extreme fear can signal bounce opportunities as markets may be overly pessimistic, but in mixed signal environments like now, downside risks cannot be ruled out. External variables like data releases must be considered together.
How does Japan’s crypto legal asset recognition impact the market?
This is a regulatory positive with medium-to-long-term benefits, but on a high-impact economic data release day like today, its short-term effect on market volatility may be limited. Legislative effects will unfold over time.
Related Posts
Newsletter
Weekly Quant & Market Insights
Get market analysis, quant strategy ideas, and AI & data tool insights delivered to your inbox.
Subscribe →